Just over a year ago, I launched a content sites project with a portfolio of six blogs in various niches. In 2019, I am documenting my progress in quarterly reports published in this blog. The Q1 report, with some additional information about the project, is available here. And now, it’s time for the Q2 traffic and revenue report!
Note: I have another large site which isn’t covered in this report because it’s a community (forum) site. I try to keep Yeys.com dedicated to my new content sites venture. My point is – I am an experienced web publisher and I have a constant stream of revenue which allows me to invest in new websites. This isn’t something I would recommend for others to do, especially if they’re new to blogging.
My web publishing strategy
This project is my first attempt at large-scale content production. Well, large by my own standards, at least. I have blogged in the past but these were always solo operations, with me writing all of the content. This time, I decided to invest money into content creation and focus my time and energy on managing the entire project.
I have the help of a wonderful dedicated full-time VA, as well as a great server admin and coder who helps me with hosting and technical issues. During Q2 I hired a part-time editor as well. She spends 10 hours a week helping me with creating task descriptions as well as editing posts delivered by writers. All of these people are awesome and I value their contribution immensely!
As for writers, over the past few months, I got my content from two sources: a content writing agency and my own team of freelance writers. Together, they accounted for the 242 posts had been published in April, May and June of 2019.
This is the content writing service. Their writing teams produced about 150 posts for my sites during Q2. They are not without their faults and required more attention and management that I was hoping for, though. A large portion of the orders needed revisions which slowed down the process and took up too much of my time.
As for freelance writers that work with me directly, they accounted for the rest of the published posts during Q2. In my experience so far, some writers just leave you after a while, for a variety of personal reasons. Which means that keeping an active team is a challenge. That’s what I liked about hiring a content service – not having to worry about finding new writers.
However, the frustration with the quality of some of the posts delivered convinced me that putting the effort into recruiting new writers was worthwhile. With the help of my VA and editor, I’ve added several high-quality prolific writers to the team in June. With the combined effort on all fronts, June ended with a total of 100 posts published that month.
For me, that’s a LOT.
(If you’re curious about how I manage post creation, you can read here about my workflow)
Ok, time to take a closer look at what happened in Q2 with each of the sites, starting from the oldest to the newest.
1. The Travel Blog
The total number of posts by the end of Q2: 139
This site was established in June 2016. It started out as a personal travel blog but I have since pruned some of the earlier content.
I still try to keep a personal tone in this blog, so while I do outsource the bulk of the writing, I write the outlines, the intros and the summaries for each post.
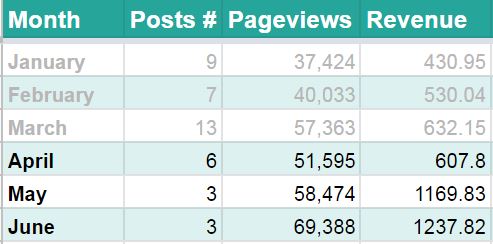
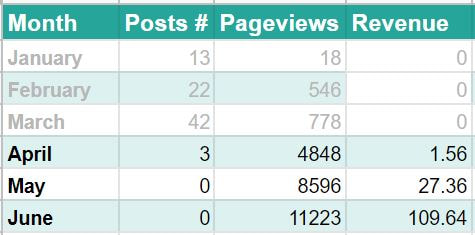
Q2 Figures for this blog
The “Posts#” column shows the number of posts added per month with the total post number at the end of June being 137. I grayed out the first three months of the year but still left them in the table, so you can see the growth along the year.
There was a decrease in traffic in early June due to DDoS attacks on my server. The only way to completely solve the issue was by moving to a new server which I did during the middle of the month. Still, there were 3-4 days with intermittent downtime which affected the overall numbers for April.
Even notwithstanding that, the site hit a plateau at the beginning of Q2 which had me worried. Fortunately, things improved significantly during June. Mostly thanks to content that was produced earlier in the year and started ranking.
As for monetization, about 75% of revenue comes from display ads, managed via Ezoic. The rest is a combination of Amazon and Booking.com affiliation fees. Revenue increased on all fronts, including Booking simply because the niche is so seasonal.
Execution vs planning
In the Q1 report, I said that the plan for this blog was to keep growing it at a rate of 100 posts per year, or about 25 per quarter. As you can see, I did not meet that goal in the second quarter of the year, with a total of only 12 published posts.
However, I did run the thorough performance analysis for the posts in this blog (which was also mentioned in the plans for Q2). That analysis is worth a post in its own right (which I’m going to write once I get around to it!). For now, I’ll just say that I think I have a better grasp of what works for this blog, as well as what doesn’t.
Goals for Q3
I really need to publish more posts in Q2. The problem is that I’m putting a lot of personal writing effort into these posts and I just don’t have the time for that right now.
With that in mind, I’ve decided to publish a series of product posts (best X for Y type) which are easier to outsource. In Q3, I hope to publish at least 30 new posts in this blog.
2. Pet Accessories Blog
I started this site in March 2018 as an experiment. It focuses on a certain line of products (imagine something like dog crates or cat collars). The content is a mix of –
Low quality “product reviews” which are basically summaries of Amazon product descriptions, including pros and cons etc.
Medium quality “Best X for Y” lists. I try to provide some added value to these by including tips for choosing the right one etc.
High-quality thorough guides relating to aspects of the topic (how to choose, how often to clean etc). I wrote most of them myself and I do know a lot about the topic.
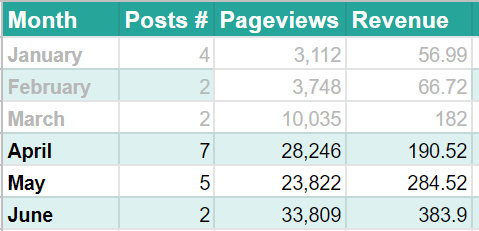
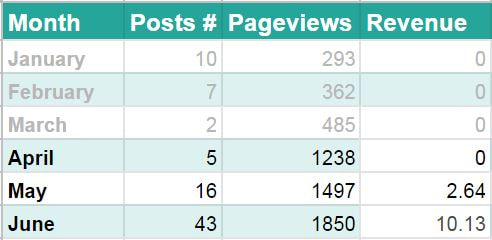
Q2 Stats for this blog
The total number of posts by the end of Q2 is 78.
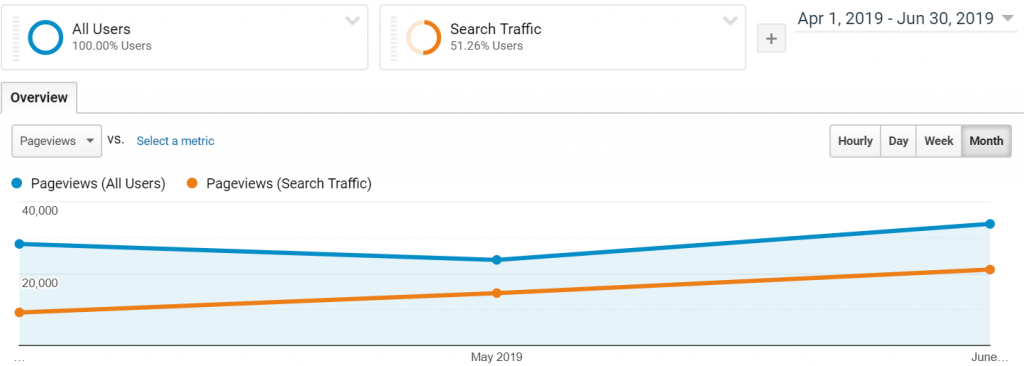
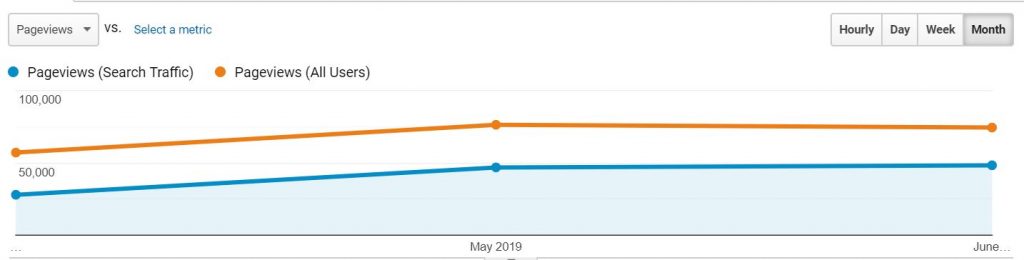
As you can see, this site keeps growing nicely in traffic. The decline in pageviews during May is entirely due to a Pinterest slump. Google search traffic was far more reliable, providing sustained monthly growth. You can see it in this graph –
Which means the site is on a good solid trajectory all in all.
This blog was monetized in Q1 exclusively via Amazon affiliate links. I’ve added Ezoic display ads into the mix in April. While there’s an overall increase in revenue, it’s mostly due to the traffic. Actual RPM figures are down in Q2.
Is that because the display ads take away from the Amazon links? Or is it just a different quality of traffic? I really don’t know. The only way to tell would be by taking Ezoic off the page again – which I’m going to do for testing purposes.
Execution vs planning
The plan was to add 2-3 posts each month in Q2 and that goal was accomplished and even exceeded with a total of 14 posts published along the entire quarter.
Goals for Q3
I don’t think this site needs more content at this point. The new posts haven’t done too well, compared to older content and I think there’s more to that than simple aging issues. In some ways, I’m scraping the bottom of the barrel with topics for this niche. I can come up with more topics but they’re too specific and don’t pull in enough traffic.
Since the site has a lot of quality content in it, and since I have so much good content to write for other sites, this one gets a break in Q3.
3. Automotive Niche Blog
The total number of posts by the end of Q2: 228
I started this blog in April 2018. The niche is a certain type of vehicles.
The content is mostly what Jim & Ricky from Income School call response posts, i.e. posts which answer an informational query people search on Google. Some are tip lists and a few are “best X of Y” top product lists.
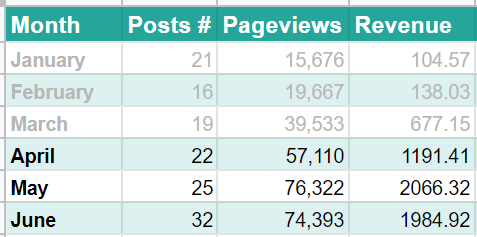
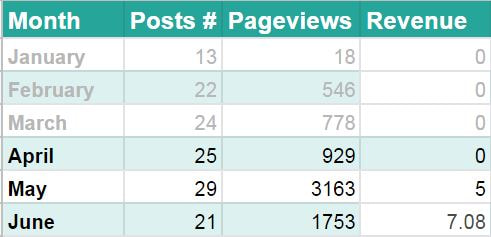
Q2 Stats for this blog
The site makes about 90% of its revenue from display ads and 10% from Amazon affiliate links. I added Viglink in and that pulled in about $30 in June as well.
Just like with the previous blog, it looks like traffic is stalling in June but that’s the same Pinterest decline. Here’s the full picture of Google search traffic vs overall traffic for this blog –
While the overall traffic was down by 1.3% between June and May, search traffic actually went up by 6%. And June is one day shorter than May, so those figures are actually a bit better in terms of average daily traffic.
Execution vs planning
I planned on adding 20 posts a month, or 60 in the entire quarter. Production surpassed that with a total of 79 posts published in Q2.
I also carried out a thorough analysis of the content on that blog, figured out which posts made the most money and which flopped. That helped me focus the content plan on what I hope are posts with better prospects.
Goals for Q3
This blog is doing very well, both in terms of traffic and revenue. RPM’s are higher than $20 pretty consistently. I also think I have a better grasp of what works for this blog and what doesn’t.
With that in mind, I plan on adding at least 30 posts per month, or a total of 90 new posts in Q3.
In addition to that, I want to improve on some of the old content. I already started doing that, currently looking to see what happens with 10 improved pieces of content before I decide whether to scale up on that project.
4. Pet niche blog
The total number of posts by the end of Q2 stayed is 100.
This is an interesting little project focusing on a specific type of small pet. I started working on this site in October 2018 and built it up to exactly 100 posts. Most of them are response posts but there are some tip lists and “best X of Y” posts.
Q2 Stats for this blog
The site had almost no posts added in Q1. I did zero work on the site, other than slap on Ezoic ads sometime in May. It’s been seeing constant growth in traffic and the subsequent growth in revenue, both from Ezoic and Amazon affiliate links.
I didn’t plan on doing much with this site in Q2 and it’s going to be more of the same in Q3. I’m curious to see what kind of traffic and revenue it’s going to get by the end of the year.
5. The Gardening Blog
The total number of posts by the end of Q2 is 95.
This site was technically started in September 2018 but was moved to a new domain in April 2019, due to an adjustment in niche focus. The content so far has been a mix of response posts, addressing specific gardening questions, gardening guides for specific plants and a few (Best X for Y) product posts.
Q2 Stats for this blog
Looks like changing the domain made no impact here. The site is growing very slowly. The rate is actually slower than I had anticipated.
Execution vs planning
I was planning on posting 20 posts per month in this blog, or 60 in the entire quarter. During April, I focused on moving to the new server and moving this site to the new domain, so had to halt production for a few weeks. That was counterbalanced by a posting spree in June which meant the 60-posts target was met and even exceeded by 9 posts.
The site was also switched to the new template, as planned and I now have a structured content plan with hundreds of future posts to be written.
Goals for Q3
This is set out to eventually become an authority site with thousands of posts. My problem at this point is that I still have no feedback on current posts. The site has a total of about 100 posts but most of them are so new, they haven’t had time to rank. Which means I can’t run a content analysis yet to identify which formats work and which don’t.
With that in mind, moving forward with this large-scale investment is scary but I’m going to keep taking that risk in Q3 and up production to 30 posts per month for this blog as well.
6. The Home Improvement Site
The total number of posts by the end of Q2 is 116.
Launched in early 2019, this site is relatively new. The posts are a mix of response and “how to” posts, with “X of Y” shopping guides.
Q1 Stats for this blog
The number of posts keeps growing and a small amount of traffic follows. About half of the traffic is from Pinterest, which also explains the higher number of pageviews in May. That was due to a spike coming from a specific pin which was repinned by an influential pinner. Otherwise, traffic is growing slowly, as is expected from a site that’s only half a year old.
Execution vs planning
I had planned on keeping a monthly posting rate of 25-30 posts in Q2 and that was achieved, even if not exceeded.
Goals for Q2
I have the same problem here, as I do with the Gardening site. The site is too young to provide good feedback as to which types of posts work and which don’t. That makes content production riskier. In addition to that, the tried-and-tested response post format doesn’t lend itself so well for such a visual niche. It’s also much more difficult to find purely informational search queries to pursue. Which means most of the posts are either inspirational photo posts or “best X for Y”-type product posts.
For Q3, I’m going to take the risk and keep on producing 25-30 posts per month for this website.
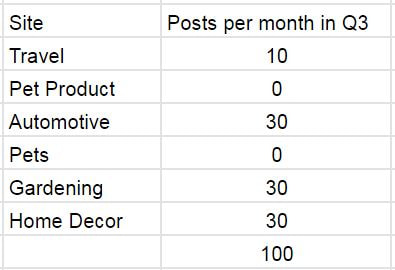
Q3 Content Plans Across the Board
One of the main reasons for writing this post is to create an overview of my Q2 plans.
In a way, this is a sort of “Board of Directors meeting” blog post. The directors being myself and whoever reads this post. (You’re more than welcome to actively participate by providing feedback in a comment below though you won’t be getting voting rights!)
So, this is what we end up with as the production plan for Q3 –
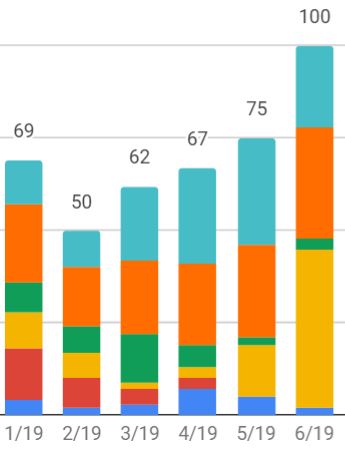
As a reminder, in the Q1 report, I was wondering whether I could meet the goal of 75 posts per month. As I mentioned in the first part of this post, using a content agency along with recruiting new writers helped me get there by the end of June.
So far, this is what production looked like in 2019 –
The colors represent the respective blogs discussed above. What matters though is the bottom line.
Moving forward, I have a dilemma.
I am fairly comfortable with my workflow at this point. I have a great team and I’m confident that I can handle production rates of 100-150 posts per month. That’s a whole lot more than what I’ve been publishing up to now. And it costs money.
Which brings me to the topic of expenses, and profits.
How much did I spend in Q2
I don’t have specific numbers here because frankly, I don’t take the time to follow expenses that closely. I believe I do have a fairly good estimate.
My cost per post is $80 on average. Some posts cost half of that while others cost more than double. That’s a good estimate for the average cost though. It takes into account an average of 2-3 paid images per post, writing costs and editing costs. I produced a total of 242 posts in Q2 which comes to a total of $19,360. Since this is just an estimate, I’ll use $20K as a conservative number, or about $6.6K a month.
Add another $1000 a month for overall expenses. These include VA costs, hosting (including server admin fees), and a variety of payments for scripts and services (premium add-ons, backup services, etc).
So, overall, I put project expenses at $22,800 in Q2.
Overall revenue was $9283 which means I invested some $13,500 out of pocket in Q2.
Moving forward, I plan on investing even more. Hopefully, the new benchmark for production will be 100 posts per month. That means a total investment of $9,000 per month or so.
I fully expect the project to stay in the red for months to come. My revenue projections predict this will be the case well into mid-2020, at which point, we should start turning a profit. Again, I work by fairly conservative assumptions, so yes, there’s a part of me that hopes things will be better. However, they could also be worse, so you just never know.
The risk is mitigated to some extent once the sites start making money. If I were to stop investing money and time tomorrow, the sites would still increase in revenue and keep providing a passive income that will cover the investment and leave a profit too.
Final Thoughts
This has been an exciting quarter in an exciting year! I won’t lie – this gets scary at times. Spending so much time and money on a project for so many months is scary. It’s a leap of faith, in many ways.
I am grateful to have the full and active support of my husband in this venture. And I am thoroughly optimistic, or I wouldn’t be pushing on. Looking forward to seeing what Q3 is going to look like!
6 Comments
Love this .. I’m also a project 24 member and jumped into Jim and Ricky’s course about 2 months ago. You’re moving at a speed maybe 2-3X faster than I am and probably are 1-2 years ahead.
I’ve been producing now since about late Feb early March and you know how daunting/demoralizing it can be to take that ‘leap of faith’ as you call it and press on.
Love that you shared. Would love to connect if you were willing and see if you had any additional learnings.
Thank you, Caleb! Would love to connect here or via the P24 forums. If you have any questions for me, just post them here in a comment. That way, others can see the answers and I’ll be gaining more content for the blog. Might even give me an idea for a post here 😉
I found your site recently and was studying your success. It’s very remarkable.
I noticed you’re a student of income school and Jon from Fat stacks. I was wondering if you recommend one course over the other? They seem similar to me as they seem to teach students to target long tail searches so I’m curious as to you’re experience with both.
Hi Roger,
I’m glad you like the site! I think both Income School and Fat Stacks offer good courses. Income School leans more towards YouTube these days, and they’ve also become very big, so you’re not likely to be in touch with Jim or Ricky directly (although they do frequent the forums there occasionally, or at least were when I was still enrolled). They do offer a very structured step-by-step protocol, which works well for some people.
Jon Dykstra has a structured course but doesn’t offer the same kind of “list of steps”. I do like that his courses focus on actual “blogging” and not YouTube. You also get to approach him directly on the forums, so if you have any questions, you’ll be getting answers from him, and not from a team member (as is often the case with IS).
I think – but I’m not 100% sure – that Fat Stacks includes lifetime access to all course materials and the forums. That’s not the case with Income School.
Overall, these days, my vote would be for Fat Stacks, especially if you’re looking for a broader view of web publishing, without YouTube.
Full disclosure – I’m an affiliate of Fat Stacks courses, but am no longer an affiliate of Income School.
[…] Q2 2019 report. […]
[…] Just over a year ago, I launched a content sites project with a portfolio of blogs in various niches. In 2019, I am documenting my progress in quarterly reports published in this blog. The Q1 report, with some additional information about the project, is available here and the Q2 report can be found here. […]
 Which means the site is on a good solid trajectory all in all.
This blog was monetized in Q1 exclusively via Amazon affiliate links. I’ve added Ezoic display ads into the mix in April. While there’s an overall increase in revenue, it’s mostly due to the traffic. Actual RPM figures are down in Q2.
Is that because the display ads take away from the Amazon links? Or is it just a different quality of traffic? I really don’t know. The only way to tell would be by taking Ezoic off the page again – which I’m going to do for testing purposes.
Which means the site is on a good solid trajectory all in all.
This blog was monetized in Q1 exclusively via Amazon affiliate links. I’ve added Ezoic display ads into the mix in April. While there’s an overall increase in revenue, it’s mostly due to the traffic. Actual RPM figures are down in Q2.
Is that because the display ads take away from the Amazon links? Or is it just a different quality of traffic? I really don’t know. The only way to tell would be by taking Ezoic off the page again – which I’m going to do for testing purposes.
 While the overall traffic was down by 1.3% between June and May, search traffic actually went up by 6%. And June is one day shorter than May, so those figures are actually a bit better in terms of average daily traffic.
 The site had almost no posts added in Q1. I did zero work on the site, other than slap on Ezoic ads sometime in May. It’s been seeing constant growth in traffic and the subsequent growth in revenue, both from Ezoic and Amazon affiliate links.
I didn’t plan on doing much with this site in Q2 and it’s going to be more of the same in Q3. I’m curious to see what kind of traffic and revenue it’s going to get by the end of the year.
The site had almost no posts added in Q1. I did zero work on the site, other than slap on Ezoic ads sometime in May. It’s been seeing constant growth in traffic and the subsequent growth in revenue, both from Ezoic and Amazon affiliate links.
I didn’t plan on doing much with this site in Q2 and it’s going to be more of the same in Q3. I’m curious to see what kind of traffic and revenue it’s going to get by the end of the year.
Love this .. I’m also a project 24 member and jumped into Jim and Ricky’s course about 2 months ago. You’re moving at a speed maybe 2-3X faster than I am and probably are 1-2 years ahead.
I’ve been producing now since about late Feb early March and you know how daunting/demoralizing it can be to take that ‘leap of faith’ as you call it and press on.
Love that you shared. Would love to connect if you were willing and see if you had any additional learnings.
Thank you, Caleb! Would love to connect here or via the P24 forums. If you have any questions for me, just post them here in a comment. That way, others can see the answers and I’ll be gaining more content for the blog. Might even give me an idea for a post here 😉
I found your site recently and was studying your success. It’s very remarkable.
I noticed you’re a student of income school and Jon from Fat stacks. I was wondering if you recommend one course over the other? They seem similar to me as they seem to teach students to target long tail searches so I’m curious as to you’re experience with both.
Hi Roger,
I’m glad you like the site! I think both Income School and Fat Stacks offer good courses. Income School leans more towards YouTube these days, and they’ve also become very big, so you’re not likely to be in touch with Jim or Ricky directly (although they do frequent the forums there occasionally, or at least were when I was still enrolled). They do offer a very structured step-by-step protocol, which works well for some people.
Jon Dykstra has a structured course but doesn’t offer the same kind of “list of steps”. I do like that his courses focus on actual “blogging” and not YouTube. You also get to approach him directly on the forums, so if you have any questions, you’ll be getting answers from him, and not from a team member (as is often the case with IS).
I think – but I’m not 100% sure – that Fat Stacks includes lifetime access to all course materials and the forums. That’s not the case with Income School.
Overall, these days, my vote would be for Fat Stacks, especially if you’re looking for a broader view of web publishing, without YouTube.
Full disclosure – I’m an affiliate of Fat Stacks courses, but am no longer an affiliate of Income School.
[…] Q2 2019 report. […]
[…] Just over a year ago, I launched a content sites project with a portfolio of blogs in various niches. In 2019, I am documenting my progress in quarterly reports published in this blog. The Q1 report, with some additional information about the project, is available here and the Q2 report can be found here. […]