Some posts only go to subscribers via email. EXCLUSIVELY.
You can read more here or simply subscribe:
July 2020 Traffic & Revenue report
July has been another great month for our business. Traffic increased by 20%, while revenue shot up by almost 40%! This report brings you the breakdown in our monthly stats, as well as our plans for the next few months (they're exciting!)
July has been another great month for our business. Traffic increased by 20%, while revenue shot up by almost 40%! This report brings you the breakdown in our monthly stats, as well as our plans for the next few months (they’re exciting!)
My apologies for the late report this month. I’m usually so thrilled about creating these reports that I publish them by the second or third day of the following month. Two things prevented me from doing that in August.
On a personal level, my dear Mother-in-law passed away unexpectedly last week. It’s been a rough few days here, and we’re still not back to our routine.
That came on top of an increased workload. We’re aiming for publishing 200 posts this month and rising to 300 per month as soon as we manage to get enough writers on the team. I’ve been super busy with recruiting new writers and making sure we have enough tasks to go around.
Once the dust settles, both personally and professionally, I’m hoping to post more here on Yeys.com. Just saying, I may not have enough time to post more here in August.
I’m active on the Fat Stacks forums, so if you want to read more, or generally network, look me up there. The board is open only to customers who buy any of the Fat Stacks courses. I have them all and can highly recommend them.
Ok, let’s move on to the report! If you’re already familiar with my business model, use the table of contents to skip to the juicy parts or go straight for the bottom line.
Contents
What is this report about?
Recap: I have a portfolio of content/niche sites. This blog – Yeys.com – is where I document my progress in detailed traffic and revenue reports. I started doing this in 2019. You can find the previous reports here.
Note: I have another large site that isn’t covered in these reports because it’s a community (forum) site. I try to keep Yeys.com dedicated to my content sites venture. Keep in mind that I am an experienced web publisher and have a constant stream of revenue, which allows me to invest in new websites. This kind of investment is not something I recommend doing if you have no reliable source of income.
My Web Publishing Strategy And Our Team
My strategy is simple –
- Find underserved queries on the Internet.
- Publish the best possible answer to the query.
- Monetize.
Multiply this by dozens of posts a month, across several niches, scaling up by outsourcing.
I currently employ four VA’s and one editor (not all of them full-time). In addition to that, I work with 15-20 freelancers that write a total of around 150 posts per month. (If you’re curious about how we manage to produce so many content items, you can read here about my workflow).
My husband also helps, especially with strategy and analysis (that’s on top of his day job). That’s why you’ll see me using “I” and “we” interchangeably.
Our Portfolio
Here’s what our collection of sites looks like at this point.
These sites cover large niches, so they have a lot of growth potential. Some are already fulfilling that potential, having 500+ posts, and growing. Others are still at the sandbox phase.
- Travel
- Automotive
- Home Improvement
- Gardening
- Finance
- Style and fashion
- Kitchen
Small niche sites
These were “carried over” from previous years before we devised the current strategy. These sites are small and will remain small simply because of the scope of the niche.
- Pet Accessories blog (a specific type of accessories)
- Pets blog (specific small pet)
Traffic and Revenue for July 2020
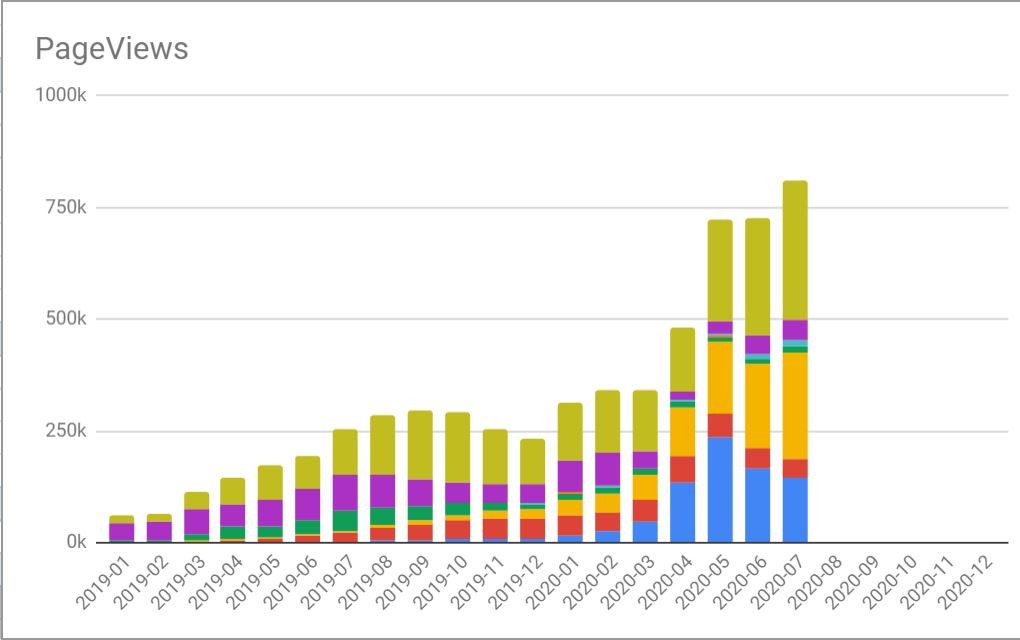
Taking into account our entire portfolio, we had a total of 811,857 pageviews. Compared to 726,720 pageviews in June, that’s an increase of about 11%.
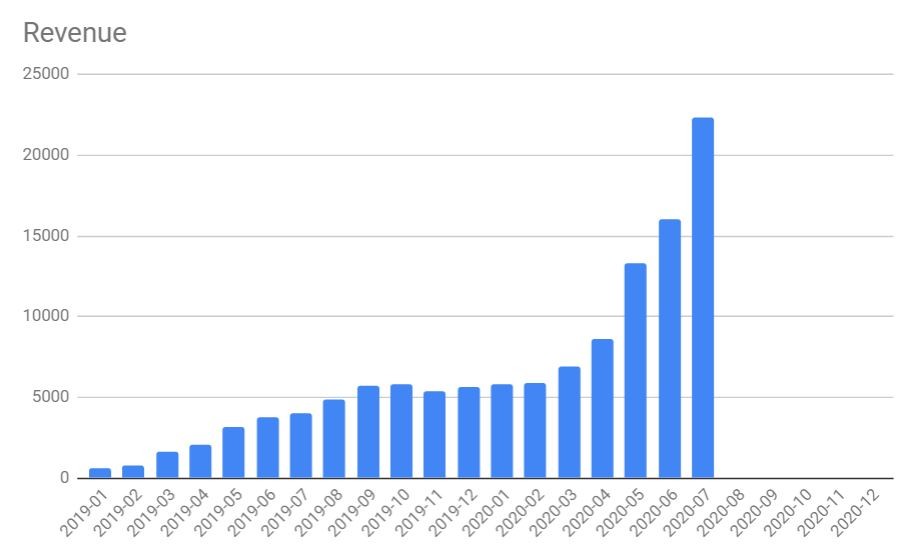
As for revenue, we made a total of $22,339 in revenue, compared to $15,997 in May. That’s an increase of almost 40%!
Is this a sweet-looking chart or what?
So, what happened here?
Let’s take a look at the numbers for July per blog.
The Travel Blog
Site history: We launched this site in June 2016. I try to keep a personal tone in this blog. While outsourcing the bulk of the writing, I’m the one writing the outlines, intros, and summaries for most of the posts.
Monetization: About 75% of revenue comes from display ads via Ezoic. The rest is a combination of Amazon and Booking.com affiliation fees.
The blog currently has a total of 248 posts. We haven’t added any content in July.
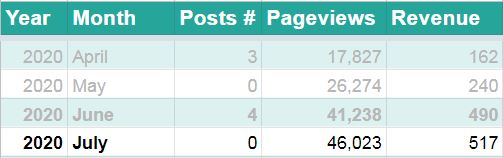
This site was making over $1500 in February. And then COVID happened, and the travel industry took a severe blow. The site pretty much crashed in April, much like any other travel blog out there.
Travel traffic is gradually increasing again. In July, the site had 46,023 pageviews, compared to 41,238 in June. Revenue increased from $490 in $517 in June.
As you can tell, our active investment in this site is minimal. As soon as we see a viable vaccine, I’m going to churn out content again (and open a bottle of champagne too.)
The Automotive Blog
Site history: We started this blog in April 2018. The niche covers vehicles of various types. The content is mostly informational with a few “best X of Y” product lists.
Monetization: The site makes about 85% of its revenue from display ads via Mediavine and 15% from Amazon affiliate links.
This blog currently has 757 posts, making it the largest in our portfolio in terms of content.
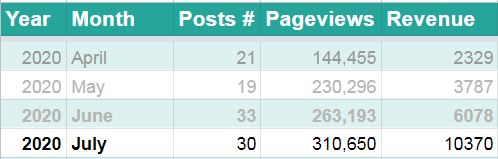
Coming out of the covid-19 slump, people are back on the road again. We reached 310,650 pageviews in July, compared to 263,193 pageviews in June. That’s a good increase of about 17%. Overall, traffic doubled in 4 months – not bad at all.
Switching to Mediavine in late June proved to be a smart decision. RPM rates with Mediavine were high, and we ended up with $10,370 in revenue, compared to $6,078 the previous month. That includes Amazon revenue.
This is our first content site to reach the 300K monthly views milestone, as well as the $10K milestone in monthly revenue.
The Home Improvement Blog
Site history: We launched the site in early 2019. The posts are a mix of informational and “how-to” posts, with inspirational picture posts and a few “X of Y” shopping guides.
Monetization: About 80% display ads via Mediavine and 20% Amazon affiliate revenue.
The site currently has a total of 671 posts.
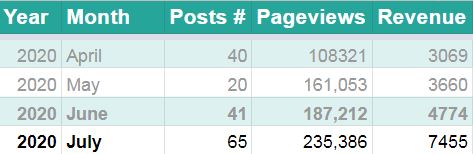
The continued content production is paying off here as well. Traffic went up by more than 25%, from 187,212 pageviews in June to 235,386 in July. Revenue went up by more than 40% from $4,774 to $7,455.
The higher increase in revenue is again, due to switching over to Mediavine in late June, along with the increase in traffic.
The Gardening Site
Site history: This site was technically launched in September 2018 as a micro-niche site but was moved to a new domain in April 2019 when we decided to cast a wider net and turn it into an authority site. The content so far has been a mix of informational posts, inspirational photo posts, and some “Best X for Y” product posts.
Monetization: About 90% from display ads, and the rest is Amazon affiliate fees.
The blog currently has just over 500 posts.
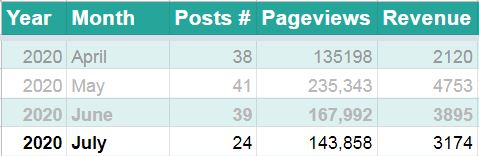
Traffic keeps going down with this one: From 167,992 pageviews in June to 143,858 in July. Revenue followed suit with a total of $3,174 down from $3,895 in June.
In the last report, I showed how this is a seasonal pattern. I confess, understanding the pattern doesn’t help me deal with the slope. We expect traffic per post to keep doing down all the way through to January. As our business model is set around a minimum of 300 pages per post, this could be a problem. We were at around 550 pageviews per post in May. We need to make sure that overall, the site can generate at least 300 pageviews a month per post on average throughout the year.
The Finance Blog
Site history: Launched in August 2019, this is an experiment in the YMYL field.
Monetization: None. The site is too small, and the traffic is too low. It does have some Amazon links in posts but not enough traffic for generating commissions.
The total number of posts remained 91.
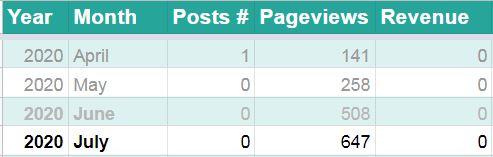
Hey, happy birthday! The site is finally a year old. I think it’s safe to say at this point that the finance niche is a challenging one. To be honest, I’m not sure it’s a mysterious YMYL effect. Or rather, it is, but not because of the topic’s significance. I hope to dedicate a post, to sum up the experiment, probably next month.
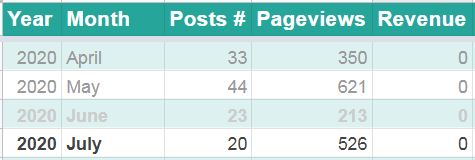
The Style and Fashion Blog
Site history: This site was launched in September 2019 (a few weeks after the finance site). The content is a mix of response posts, guides, and lists of inspirational images.
Monetization: No display ads. Amazon links on some pages.
The current number of posts is 140.
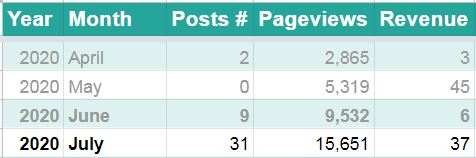
The site had 15,651 pageviews in July, compared to 9,532 in June. That’s a nice increase of more than 60%. At least part of the growth can be attributed to Pinterest, where we applied Jon Dykstra’s Pinterest strategy with good results. This is also what happens when a site comes out of the sandbox (which happened gradually over the last three months and is an ongoing process). As you can see, we started putting more content into the site.
I’m going to board the site to Ezoic this month, and we can start seeing some additional revenue soon.
The Pet Accessories Blog
Site history: This site was launched in March 2018. It includes high-quality guides relating to aspects of the topic (how to choose, how often to clean, etc.). We also have some “X for Y” lists.
Monetization: Display ads by Ezoic account for about half of the revenue, with Amazon bringing in the other half.
The site currently has 80 posts.
This particular site was doing very well over the summer, reaching over 40,000 pageviews a month and generating more than $2700 in revenue during August 2019. For some reason, it was hit during the October algorithm update and then again in November. Traffic has stabilized somewhat over the last three months, but the overall trend is downwards.
We saw a gradual increase in pageviews in July and a corresponding increase in revenue to just over $200.
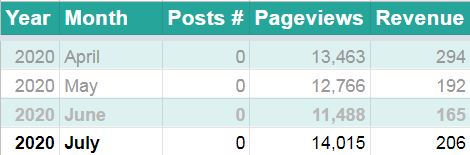
The small pets blog
Site history: Launched in October 2018, we built this site up to 100 posts (with the last posts added in April 2019). As for the type of content, it’s mostly response posts, but there are some tip lists and “best X of Y” posts.
Monetization: The site is monetized with a combination of display ads via Mediavine and Amazon links. About 50% of the revenue comes from each of these channels.
The site has 100 posts.
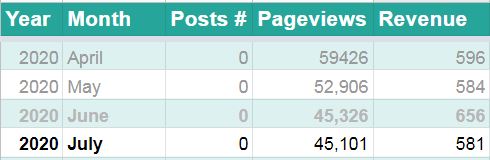
After a drop in traffic in June, traffic seems to be stable in July with just over 45K pageviews that generated $581. This website has been entirely passive for more than a year now with around 400-500 pageviews per post, so we’re happy with it.
The Kitchen Blog
Site history: The newest site in this bunch was launched in March 2020. The original plan was to build it up to 100 posts, going after long-tail response posts, with some tip lists and “best X of Y” posts. It’s doing much better than we expected with actual search traffic coming in from the first month. With that in mind, we decided to keep pushing content.
Monetization: There are Amazon links in some posts but nothing else (it’s brand new).
The site currently has 130 posts.
The exact numbers don’t mean much at this point. We’re still buried in the sandbox. I just like seeing Google taking note of the site so early.
Expenses in July
I used to bundle in expenses and investment in this section, but that doesn’t reflect the value produced by the sites. I mentioned as much last month, but this time around, I’m dividing these into two sections. Mind you, this isn’t a clear and cut division – mostly an estimate.
So here’s a breakdown of our expenses in June. These are things that we would keep on paying, even if we stopped producing or promoting content altogether.
- $100 – hosting expenses
- $400 – Software (plugins, templates, task management, SEO tools, etc.)
- $800 – VA cost for essential business management (I would keep this even if we stopped creating content).
That comes to a total of $1,300
Content Investment in July
The following is money that we decided to invest back into creating more content. If we stopped creating and promoting content altogether, this would be money in the bank.
We produced 170 posts in June and finally increased the additional three VA positions back to full-time.
- $300 – Stock photos
- $1,800 VA fees (VA hours that go directly into content production and promotion)
- $500 Editor fees
- $6,400 writers (overall number of words that we published multiplied by 3 cents).
Total of content investment: $9,000 (compared to $8,022 in May)
The fiscal bottom line for July
We had a total of $22,339 in revenue and $1,300 in expenses.
That means we made $21,029 profit in July.
We then invested $9,000 into the content.
That leaves us with $12,029 “in the bank” by the end of the month.
We went up from $14,897 to $22,339 in profit. That’s an increase of almost 50%!
Even after investing more in content, we still increased our income from $6,875 to $10,739 – an increase of almost $4,000.
Higher RPMs, along with constant content production over the last year, are paying off. I think I’m also getting better with choosing queries, which helps newer content rank faster.
What’s next?
I don’t expect the coming months to show such sharp increases. I’ll be more than happy to be proven wrong, of course. Our projections are for improvements in increments of $1500 per month moving forward. We plan on increasing the number of posts published per month, so at some point, the increment is likely to increase.
Yes, you read that right. Things are going well, and we want to invest all of the excess monthly revenue back into generating more content. Don’t get me wrong – this is a risky business. We are fully aware of the risk, but we feel that at this point, we have the upper hand, and we want to make the most of that.
With that in mind, the plan is to up production to 200 posts per month in August and shoot for 300 per month for the rest of the year. That means an investment of over $15,000 in content every month.
With more posts, we’re also looking to diversify our portfolio. I’m hoping to launch two more sites this year, but we won’t be covering them in Yeys. The report is getting too time-consuming for me to produce, and I don’t think I can handle more sites. I wonder whether just to keep covering the existing nine sites in this report, or cover the business as a whole, without a breakdown? I want to keep these reports going, at least until the end of the year.
As always, please leave me a comment and let me know what July was like for you! And stay safe, always!
Hi Anne,
As usual, great to read that your business keeps growing. Shows the power of choosing one thing and sticking with it long term. 🙂 Also glad to see your travel blog having recovered considerably from its lowest point. Mine is 90% focused on international air travel, so it’s still more than miserable!
For your reports, maybe you can covering these nine sites the way you’ve been doing and do the other two as a separate “one-year after launch” or something case study? Something along the lines of what I’ve done here: https://keishinukina.com/authority-site-case-study/
Looking forward to reading the next report!
Keishi
Love your blog, Keishi! I signed up for the newsletter and will dive into more posts later. That’s a great case study you have there. I like the idea of providing case studies for future projects – thank you!
Thanks, Anne!
Great report as always Anne,
What a tremendous growth for the month of July. What you’re doing is really working wonders for you, and you’ve got to keep the ball rolling mate.
The most interesting part of it all is that you’re not doing any form of link building for your site yet, they’re seeing this kinda growth.
Keep it up Anne, and I’m sure you’ll cross the $30k mark within the next couple of months.
Thank you, Theodore! I hadn’t planned on getting to the $30K mark in 2020, but it certainly seems feasible now. Not sure that it would happen within a couple of months, as I think growth should be slowing a little bit now that all of the sites are with Mediavine. No “quick gains” on the horizon for now, but you never know!
Nice! Definitely inspiring, Anne. 🙂
Thanks, Marty!
Another great report Anne. Love reading these!
Sorry for your loss, Anne!
I was waiting for this report since the first!
Don’t give up!
Thank you!
Great post and a dose of motivation. I am currently serving ads via Ezoic on my blog. Although I am qualified for Mediavine (for their new traffic terms) I am bit skeptical of switching. I heard from Spencer Haws in his blog posts that it makes very less difference. Since you have used both, what’s your thoughts on this? Should I switch to Mediavine OR wait for getting enough numbers that can be qualified for Adthrive as its the best?
Good question, Meen. I haven’t tried Adthrive, but from what I hear, they’re about the same as Mediavine. For some niches, they may be able to bring slightly higher RPM’s but for others, MV is often better. Overall, they are very similar.
With that in mind, I wouldn’t wait for the 100K threshold. You have no guarantee of them accepting your site at that point, anyway. I would just try Mediavine at 50K and see how it compares to Ezoic. Ezoic is a decent option on its own, for many sites and niches.
Thanks for the detailed report, Anne.
One quick question (and apologies if you’ve covered this elsewhere – I’m a new reader and couldn’t find it) – what’s your definition of a pageview? And hence RPM?
Is it sessions (or even users) as defined by google? Or is it the number of pages, well, viewed (noting that a session may involve more than one page viewed).
There seems to be a lot of confusion on this (eg AdSense defines RPM as revenue per page viewed where Mediavine quotes revenue per session).
Given some of the RPM numbers ($20-$30) you seem to be achieving I assume it’s the Mediavine definition…?
Chris
Hi Chris,
I’m old-school, so I still look at pageviews for my own needs. My RPM quotes are actually based on overall revenue (display ads and affiliate revenue together) divided by the number of monthly pageviews.
Great post. Fort time here.
Question- when you say you invested 10k into the content, do you mean paying VA/writers for articles?
That seems quite a lot.
I’m glad you liked the post, Marci!
The investment in content represents what we pay our writers (the bulk of the sum), our editors and three VA’s, as well as the stock photo site subscriptions. Basically, everything that we need beyond maintaining stable sites without any new content. It is a lot – it’s the cost of 150 posts per month.
Love these Anne, congratulations on the rapid growth.
Thanks, Evan!
First time on your site Anne and am liking your content. Came from a post on Skipblast.
Congratulations on producing that much content on a monthly basis. Do you just do your research with a keyword research tool, outline everything then send the work to the writers you’ve hired?
Hi Philos,
Thanks for visiting and leaving a comment – much appreciated!
I’ve tried several research tools but I keep going back to just searching Google, seeing what people also ask for and using Google auto-complete. Works for me so far and actually is faster than using Ahrefs or a similar tool. Once I have the topics, we use fixed templates by type of topic (i.e. tip list, informational post, product post etc) and then I let one of our editors fine-tune the task description with additional questions. The writers can then see these topics and assign tasks to themselves. You can read more about our system here.