Some posts only go to subscribers via email. EXCLUSIVELY.
You can read more here or simply subscribe:
March 2020 Traffic & Revenue Report
Wasn’t March the longest month ever? It sure felt like that to me. So much has changed in the world; I find it hard to wrap my mind around it all. But hey, even the longest month in our lives has to end sometime! And it’s time to take a look and see what happened in my business.
Contents
The Executive Summary
I’m relieved to say that overall, our sites did well. Except for one site, most of them made it through the month with an increase in traffic, revenue, or both.
Overall, traffic went down a little this month, mostly due to our travel site taking a hit (Corona-driven). However, revenue went up for various (site-specific) reasons. Overall, we’ve had our best month ever in terms of revenue. With costs going down, this was also the best month in terms of profit.
So what is this report?
Here’s a quick recap. I have a portfolio of content/niche sites. This blog – Yeys.com – is where I document my progress in detailed traffic and revenue reports. I started doing this in 2019. You can find the previous reports here.
Note: I have another large site that isn’t covered in these reports because it’s a community (forum) site. I try to keep Yeys.com dedicated to my content sites venture. If you’re a newbie reading this, please keep in mind that I am an experienced web publisher and have a constant stream of revenue, which allows me to invest in new websites.
My Web Publishing Strategy And Our Team
My strategy is simple –
- Find underserved queries on the internet.
- Publish the best possible answer to the query.
- Monetize.
Multiply this by dozens of posts a month, across several niches, scaling up by outsourcing.
I currently employ four VA’s and two editors (not all of them full-time). This the core of my team. In addition to that, I work with 20-30 freelancers that write a total of 150+ posts per month. (If you’re curious about how I manage post production, you can read here about my workflow).
My husband also helps, especially with strategy and analysis (that’s on top of his day job). That’s why you’ll see me using “I” and “we” interchangeably.
Introducing our portfolio
Our current strategy goes like this:
- Add one content site to the mix every quarter, launching it with 100 posts.
- Let it brew for an additional half a year, to see how the niche feels.
- If it’s going well, keep pushing content and making it into a large authority site.
- If it doesn’t – no harm done, we have a smallish site in the portfolio that will pay for itself within a couple of years.
So, this is where we stand now –
(Potentially) Large niches sites
- Travel
- Automotive
- Home Improvement
- Gardening
- Finance
- Style and fashion
- Kitchen
Small niche sites
These were “carried over” from previous years before we devised the current strategy.
- Pet Accessories blog (a specific type of accessories)
- Pets blog (specific small pet)
Traffic and Revenue for March 2020
Taking into account our entire portfolio, we had a total of 340,412 pageviews. Compared to 342,193 pageviews in February. That’s a decrease in traffic, especially considering March was two days longer.
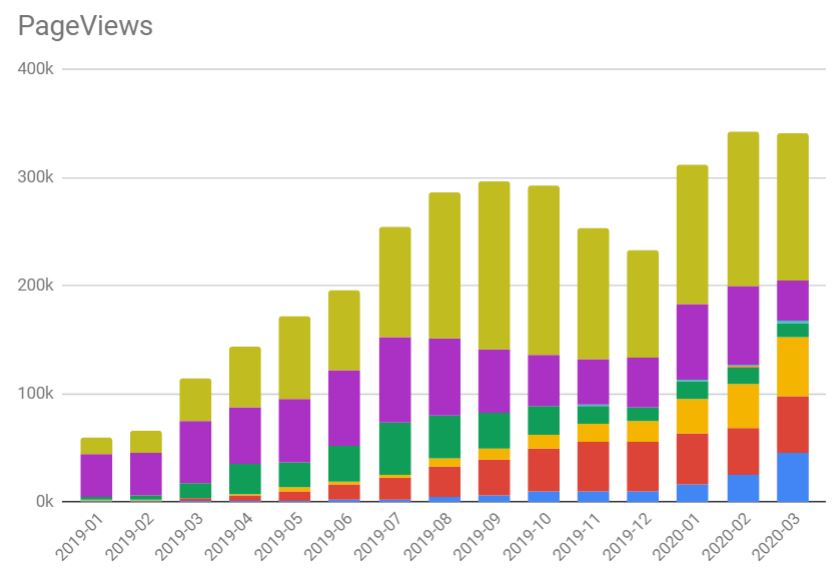
As you’ll see in a minute, this is mostly due to COVID-19’s effect on our travel site. It pretty much crashed.
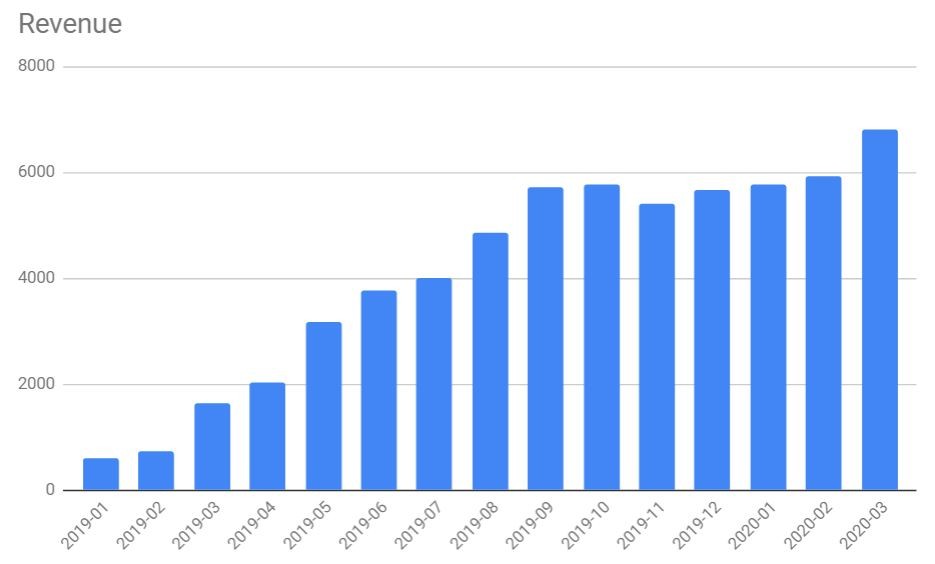
In terms of revenue, fortunately, after a dip in early and mid-March, the last week of the month was much better. Overall, revenue went up to a total of $6,813. Compared to $5,765 in February. That’s an increase of more than 15%. Sweet, considering how volatile March has been for so many web publishers.
What happened here?
In the first week of March, I published a post on COVID-19’s effects on the industry. In that post, I estimated that traffic would go down for a while until people adjust to the new threat. I figured they’d be busy trying to figure out what’s going on, spending less time on leisure topics, and focusing on getting ready for the hard times ahead. If I may quote myself –
As primary containment measures are taken, the severity of the situation will begin to dawn on people. Judging by my Facebook feed, 90% of people still don’t realize how bad things are. As they begin to figure things out, their attention will be drawn away from “pastime searches.” People just won’t be in the mood to look for a new dress or information about caring for their pet grasshopper.
The next phase was supposed to be better for web publishers, as people would be spending more time at home, ordering more things online rather than going to the stores.
As people get used to the idea, they’ll all have to adjust to living with COVID-19. Once the initial panic subsides, we’ll probably see these cultural changes –
- Avoiding flights and overseas travel.
- Staying at home instead of going out to cinemas and restaurants.
- Working and studying from home.
- Ordering online instead of going out to the stores.
Did you catch that last one? Yay! A ray of light for us web publishers.
Looking at the stats here, I think the process is happening right before our eyes. Overall, traffic for our “leisure” content dipped in mid-March. Then, in the last week of March, we began to see the effects of people staying at home and ordering online. There was an apparent increase in affiliation fees from Amazon.
I also estimated that display ads RPM’s will catch up at some point. I’m not seeing that just yet, but I’m hopeful that it will happen sometime during April. The caveat being that April is going to be one of the roughest ever, in terms of deaths from COVID-19. The US is already past 5,000 deaths. Some people were upset with me for saying things will get very bad, but hey, even Trump admitted this week that the death toll is likely to be over 200,000 deaths, and that’s WITH extreme containment measures in place. Without them, it could be even worse.
Not to get into the COVID-19 death toll argument here, my point is that it’s difficult to predict what people shopping patterns will look like in April. They may be too fearful of spending money on gardening or home decor. Or it could be the opposite, and they may look for ways to feel better by shopping online while staying at home in isolation.
Ok, enough analysis. Let’s take a look at the numbers for March per blog.
The Travel Blog
Site history: This site was established in June 2016. I try to keep a personal tone in this blog, so while outsourcing the bulk of the writing, I’m the one writing the outlines, intros, and summaries for most of the posts.
Monetization: About 75% of revenue comes from display ads, managed via Ezoic. The rest is a combination of Amazon and Booking.com affiliation fees.
The blog currently has a total of 243 posts.
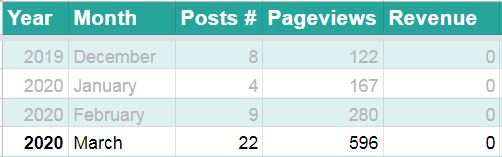
This blog was doing so well up until February. March corona madness hit it hard. With people no longer flying and traveling, traffic sank, and revenue went down along with it.
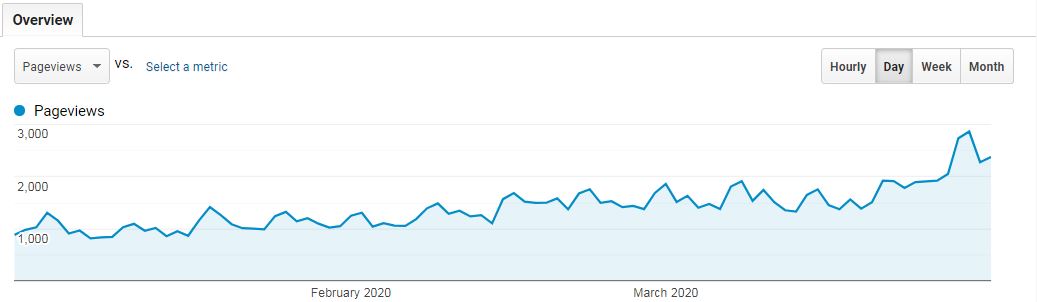
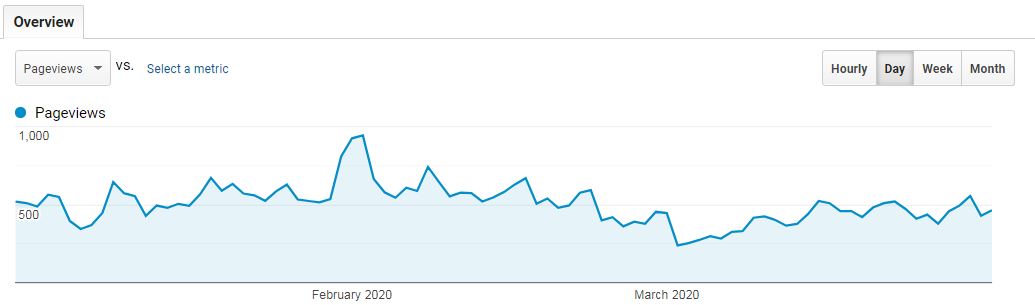
And if you think these stats aren’t too bad, you need to see this chart from Google Analytics –
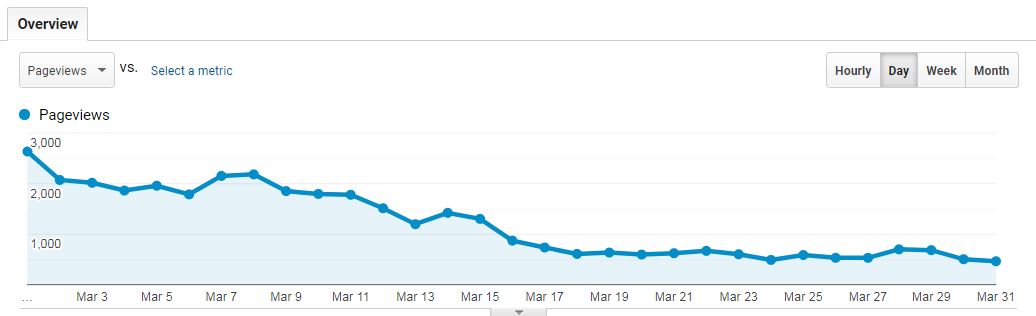
Averaging out the month doesn’t tell the whole story. Traffic has been declining since mid-February. Comparing the last week in March with a week in early February shows a decline of close to 80% in traffic.
And that’s not all. Travel is a seasonable niche, so we were expecting March to have much better traffic than February. I would say the site took a hit of over 90% of potential traffic due to COVID-19.
Travel is one of the worst niches to be in right now. Fortunately, we’re evenly spread out across niches.
The Automotive Blog
Site history: We started this blog in April 2018. The niche covers vehicles of various classes and types. The content is mostly informational with a few “best X of Y” product lists.
Monetization: The site makes about 75% of its revenue from display ads via Monumetric and 25% from Amazon affiliate links.
This blog currently has 652 posts, making it the largest in our portfolio.
In March, traffic declined to 135,548 pageviews, compared to 142,312 pageviews in February. However, revenue went up from $2,112.91 to $2776.
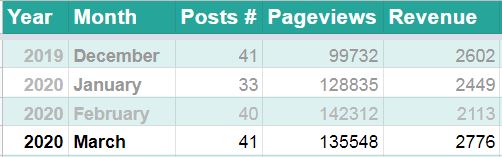
Traffic wise, here too, we felt the corona effect, albeit not to the same extent as we did in the travel niche. Traffic was down by around 7%. Revenue went up, but that’s actually somewhat misleading. February saw a dip in revenue due to Ezoic issues and us having to move the site to Monumetric. March was pretty steady and also two days longer. The additional three days of revenue and overall decent RPM’s made for an overall increase in revenue in March. I will say that RPM’s did go down during March. From $14-15 to $11-12.
The Home Improvement Blog
Site history: This site was launched in early 2019. The posts are a mix of informational and “how-to” posts, with inspirational picture posts and a few “X of Y” shopping guides.
Monetization: Approximately 60% display ads (Ezoic) and 40% Amazon.
The blog currently has a total of 505 posts.
I’m happy to report a nice increase in both traffic and revenue. We went up from 40,245 pageviews in February to 54,831 in March. The revenue went up from $1344 to $2098.
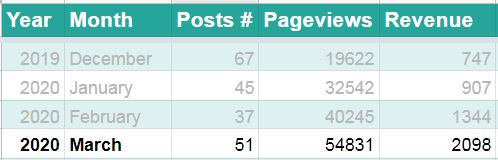
If you look at the traffic along the last three months, you’d think there was no corona in this world –
However, we were expecting an even higher increase in both traffic and revenue, simply thanks to the large number of posts that are finally maturing. Things were tense during the first week of March when growth seemed to have halted. I guess that people were too busy reading the news and seeking information regarding the pandemic, which affected our growth curve. Fortunately, things bounced back later in the month.
The Gardening Blog
Site history: This site was technically launched in September 2018 as a micro-niche site but was moved to a new domain in April 2019 when we decided to cast a wider net and turn it into an authority site. The content so far has been a mix of response posts, gardening guides, inspirational photo posts, and some “Best X for Y” product posts.
Monetization: During March, the site was monetized with Google Adsense and Amazon.
The blog currently has 353 posts.
We saw a very welcome increase in traffic in March. Pageviews nearly doubled, going from 24,969 pageviews to 45,516! Revenue followed suit with $574 (up from $148 the previous month).
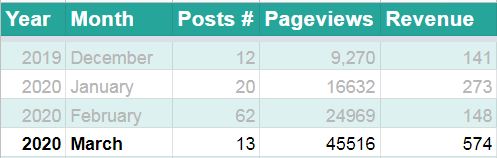
Seasonality is finally kicking in for this site, and with people spending more time at home, this site is doing well. Gardening is also strongly correlated with homesteading, probably giving the site an additional boost. The site started doing very well on Amazon, especially towards the end of the month. Display ads are still underperforming because we only have Adsense there. Fingers crossed, we’ll finish the approval process with Mediavine any day now and start monetizing display ads more effectively.
Moving on to the smaller sites.
The Finance Blog
Site history: Launched in August 2019, this is an experiment in the YMYL field.
Monetization: None. The site is too small, and the traffic is too low. It does have some Amazon links in posts but not enough traffic for generating commissions.
The total number of posts at this point is 91.
Traffic is slowly going up. Very slowly. Most pages don’t rank at all, and the ones that do, pull in a couple of dozens of views each.
As expected, breaking into a YMYL niche is hard. But we’re not losing hope just yet. This is an experiment, and we won’t know how it goes until at least a year from now. We’re sealing off the site at 91 posts. Time to let it simmer for a while.
The Style and Fashion Blog
Site history: This site was launched in September 2019 (a few weeks after the finance site). The content is a mix of response posts, guides, and lists of inspirational images.
Monetization: No display ads. Amazon links on some pages.
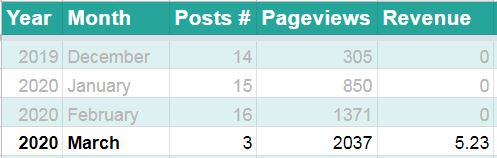
The number of posts now is 98. It’s close to the 100-posts mark we were aiming at.
The site had 2037 pageviews in March. That’s a nice increase from February’s 1371 but still, sandbox numbers. We did see a couple of Amazon sales, though, so the site made just over $5! Woohoo! That first time that a new site makes any kind of revenue $5 is always very exciting.
The Pet Accessories Blog
Site history: This site was launched in March 2018. It includes high-quality guides relating to aspects of the topic (how to choose, how often to clean etc.). We also have some “X for Y” lists.
Monetization: Display ads by Ezoic account for about half of the revenue, with Amazon bringing in the other half.
The site has 96 posts. We’ve actually added a bunch of posts in March, following a long dormant period.
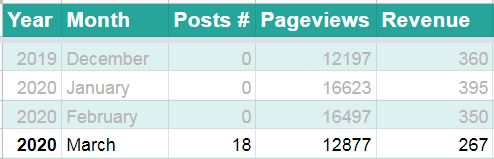
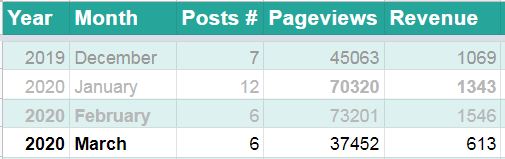
This particular site was doing very well over the summer, reaching over 40,000 pageviews a month and generating more than $2700 in revenue during August 2019. For some reason, it was hit during the October algorithm update and then again in November. December was pretty bad.
In January 2020, we saw the first signs of the site rebounding. It was holding its own in February but not much more, then went down again in early March and bounced back a little bit later in the month. Quite the roller coaster.
Here’s what Q1 looked like –
I wish I could say the upwards trend was thanks to the additional content. In fact, the posts that went up in traffic were enjoying a corona-driven boost. They all deal with handling that particular pet’s needs during emergencies.
The small pets blog
Site history: This site was launched in October 2018, and we built it up to precisely 100 posts (with the last posts added in April 2019). As for the type of content, it’s mostly response posts, but there are some tip lists and “best X of Y” posts.
Monetization: The site is monetized with a combination of display ads via Mediavine and Amazon links. About 50% of the revenue comes from each of these channels.
Traffic went up again this month, from 43,317 to 51,555 pageviews. Some of that is simply the effect of March being a longer month.
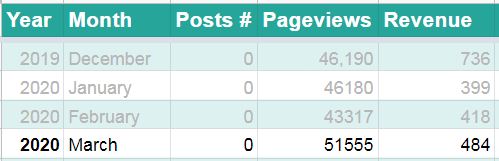
This has been the first month for the site to be monetized via Mediavine. It was still running Ezoic during the first week, and then over the last three weeks, ads were being delivered by Mediavine. RPM’s went up from $4-5 to $10-11, which is very nice. I’m not sure if the additional increase in traffic is due to increased speed due to the change, but it might be. Either way, switching to Mediavine increased our revenue.
The Kitchen Blog
Woohoo! Yes! A new blog!
Our strategy calls for adding a new site every quarter. We were going to skip that in Q1 because we were supposed to spend March traveling in Florida. COVID-19 made us cancel the trip, so I decided to move ahead with the original plan and launch the new site. It’s a brand new hatchling, with only eight published posts. I don’t expect it to get any traffic anytime soon, but you have to start somewhere. I’ll be adding it to the reports as of the next month.
Expenses and Investment in March
Unlike with revenue, I can only provide estimates here. It’s just too much time and work to try and collect every little payment out there.
The exception is the cost of written content (how much we pay writers). I calculate the cost of content by taking the overall number of words that we published and multiplying that by 3 cents (which is how much we pay writers per word).
A few changes that took place in March –
- My trusted server admin had to leave due to other obligations. I switched to using a different service that charges me by the hour. Since there’s very little maintenance required, overall hosting expenses went down to around $100 a month.
- Concerns over the COVID-19 slowdown in mid-March made us cut back on the number of published posts. Or at least try to. We went down in the overall number of published posts, from 170 in February to 161 in March.
- For the same reasons, anything that wasn’t absolutely needed for publishing content was put on halt, and we cut back on VA hours.
- The overall decrease also meant fewer editor hours.
So here’s a breakdown of our expenses in March:
$100 – hosting expenses
$400 – Software (plugins, templates, task management, SEO tools, etc.)
$300 – Stock photos
$2,000 VA fees (four VA’s)
$700 Editor fees
$288 Ezoic premium fees
$6,417 writers
That comes to a total of $10,205 (compared to $12,139 in February).
The fiscal bottom line
We had a total of $6,817 in revenue and $10,205 in expenses. That means we “made” -$3,388 in March. Still in the red, but that is the best month we’ve had since we started. And we’re still going strong, according to our projected timeline. Considering just how bad this month could have been, I’m very pleased.
Final Words
So, there you have it. That’s our report for March. As stated earlier, I don’t feel that we’re out of the Corona woods just yet. April is going to be another unpredictable month.
Please leave me a comment and let me know what March was like for you. Most importantly, please, please stay safe and stay at home. Staying at home could literally save your life and the lives of those around you.
Good read, as usual, keep them coming 🙂
Appreciate the work you put into your posts and all the valuable details that could help less experienced people, like me, learn more about this business
Me and my partner just bought our first site in an evergreen niche, didn’t do our due diligence properly and realized that we have to redo all 25 posts as they are in a VERY bad shape… apart from other stuff we have to change and improve
But we’re hopeful and motivated to make it work, to learn from people like you and hopefully to escape the 9-to-5 😀
Have a great weekend!
Thanks, Alex! I’m glad you enjoyed the post. Good luck with the new site! Fortunately, fixing content issues is something you can actually do fairly easily. I hope there’s some traffic coming in all the same, so you can start seeing improvement sooner rather than later.
My blog is reaching the one year mark. It is in the healthcare niche. I just switched from Ezoic to Monumetric to see if I can get better returns. I need to give it a few weeks and see how it pans out. March was good for me in healthcare plus I zeroed my articles in on the virus. So that helped.
Hi Ron, that’s awesome to hear! You’re one of the lucky few who can actually write about medical issues with authority. I’d love to hear more about how Monumetric does, compared to Ezoic, in a few weeks time. For my automotive niche, they had very similar results.