Some posts only go to subscribers via email. EXCLUSIVELY.
You can read more here or simply subscribe:
Why was there so much traffic in May? [And will that continue in June too?]
A few days ago, I posted our report for May. Both traffic and revenue grew by over 50% compared to April. But was that sustainable growth or just a fluke? Will traffic keep growing at the same rate during June?
I watch my numbers like a hawk. It’s probably an unhealthy addiction, but I check the stats for all my sites daily. During May, the gardening and home improvement sites boomed. The automotive site joined them around mid-May. When I discussed their growth figures in May’s report, I mentioned that there could be three factors at play here –
- We added a lot of new content in early 2020, and a lot of that was finally maturing.
- These niches all have some seasonality with traffic going up during springtime.
The third factor was COVID-19.
It was difficult to assess its impact, though, because the sites are relatively new. I don’t have a history going back several years with those sites. Which means it’s challenging to assess seasonality.
Then I noticed another strange trend. The growth halted in June (that actually started in late May, following Memorial Day).
Traffic went down a little for the gardening site, and it plateaued for the home improvement and automotive website.
And here’s something interesting: It went up a little for the travel site. That particular trend actually began in May. But during the first week of June, it was in contrast to what the other sites were doing.
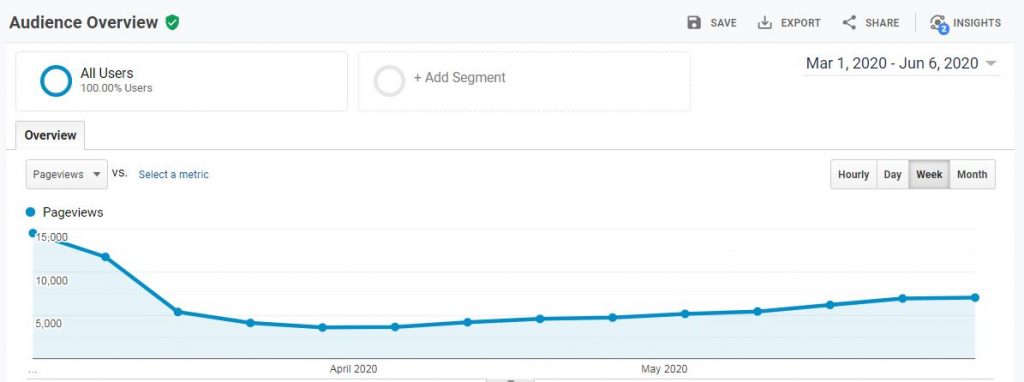
That travel site tanked in March when the pandemic hit the entire sector. It’s fascinating to watch the recovery process.
How COVID-19 affected various niches
The changes in traffic made me wonder just how much COVID-19 affected traffic trends in the last couple of months. I work from home, and my kids are homeschooled. I can’t say that lockdowns affected our family too much. However, the corona situation clearly affected most people bringing on a drastic change in lifestyle.
Have you seen the “Corona Bingo” games going around? I’ve seen several versions already. It’s a bingo board where you have to cross your “corona activities”.
Along with “used hand sanitizer” and “watched Netflix,” I noticed things like “baked bread” and “grew vegetables at home.” Clearly, some pastimes were almost universally popular.
Judging by what people posted in web publishing forums, it soon became apparent that some niches were busted, and yet others were booming. Travel bloggers were hit the worst. I can attest that traffic for our travel site went down by almost 90%. The big winners were food recipe sites. And within those, comfort food ruled. People weren’t interested in keto diets in May. They were all about pasta and cake. Bloggers who focused on comfort food reported that their traffic doubled, tripled, and even quadrupled during May.
Google Trends paints an interesting picture.
While May was good for my business, I was worried that maybe that was just a “corona fluke”. A crazy spike in traffic that happened because I have enough content on websites that match covid-19 trends. And maybe those trends are now beginning to decline?
I went over to Google Trends to see whether my traffic fluctuations matched search trends.
To do that, I searched for traffic trends over the last two years. That timeframe let me compare the current spring season with the spring of 2019. To make it easier to compare them, I highlighted March through May. I also ran trend searches for five years, just to make sure the seasonal patterns were stable and 2019 wasn’t weird in any way. It wasn’t. 2020 was.
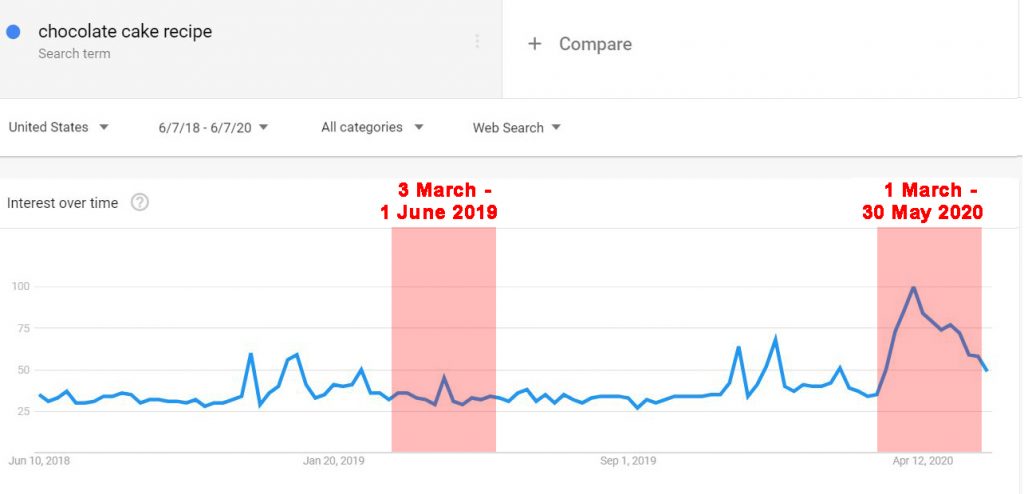
This is what it looks like for gardening –
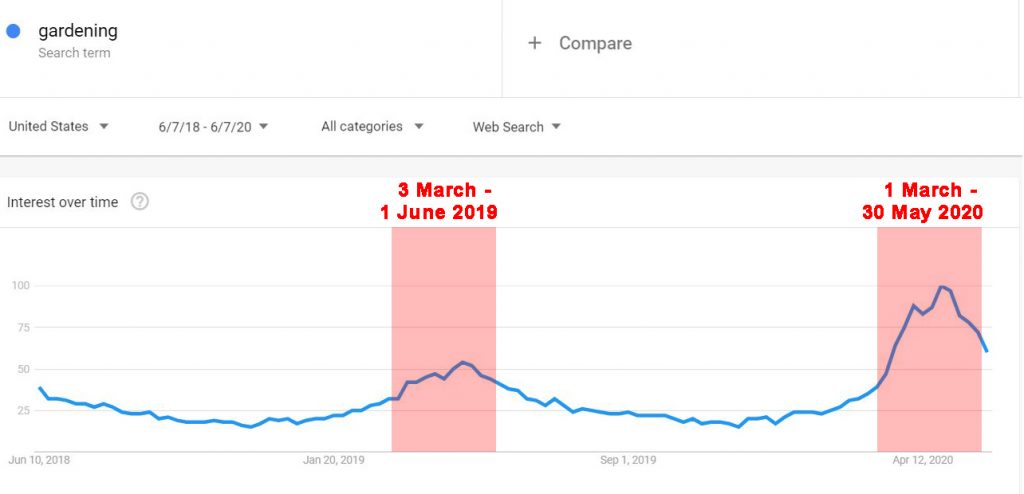
It’s easy to see that March, April, and May are the best months of the year for gardening. So, yes, definitely a seasonal traffic pattern. However, in 2020 we had a significant boost during the same months. It does seem like my gardening site’s traffic explosion was at least in part due to COVID-19. What’s more, the downward trend in the last week or two seems to be niche-wide.
The good news is that we still see very high search levels. Almost as if the corona is still affecting the niche. The same seasonality trend – only on steroids.
The effect is even more evident when you look at the term “growing vegetables” –
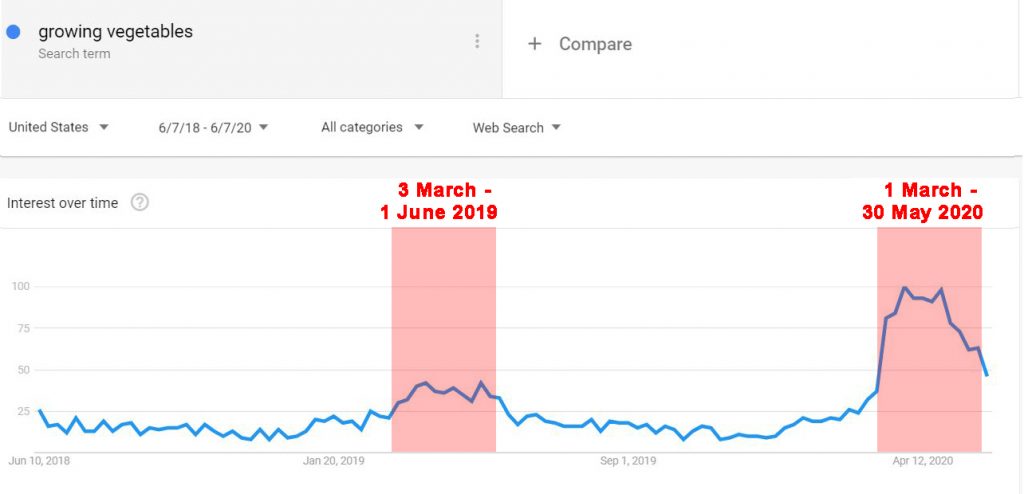
Holy Batman, that was the season for growing veggies! (Am I the only one seeing Batman there?)
I also checked things like “growing flowers” and “growing roses.” They all show a distinct increase in the spring of 2020, but not as drastic as growing vegetables.
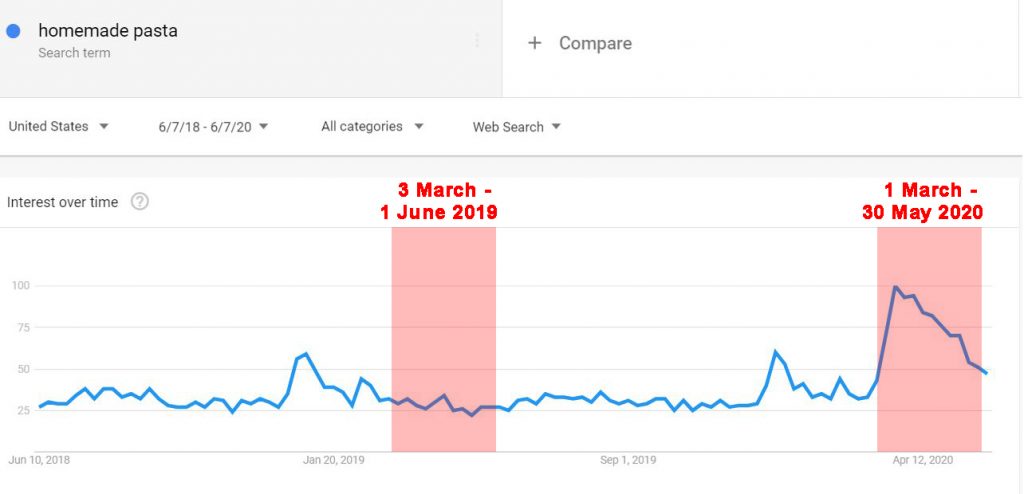
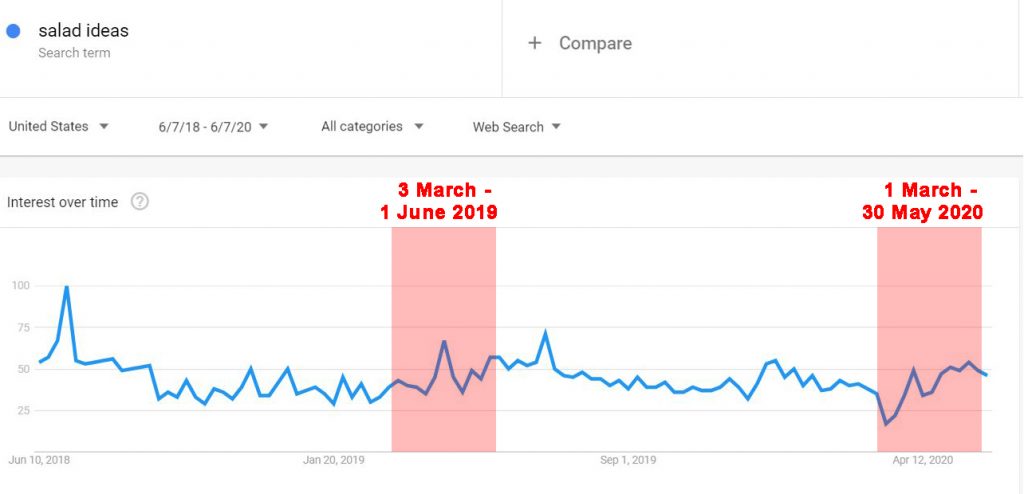
Let’s take a look at food search terms trends. Not my niche, but interesting to see the trends there.
It looks like people were making pasta.
And delicious desserts too.
And my fellow food bloggers were right. Salad recipes went down at the same time (compared to the same weeks in 2019).
It makes you wonder why everyone was growing so many vegetables.
The same decline in March is showing up for terms like “weight loss”, “healthy diet” etc. Comfort food clearly ruled the scene.
Anyway, back to my niches. The home improvement niche showed a trend similar to that of gardening.
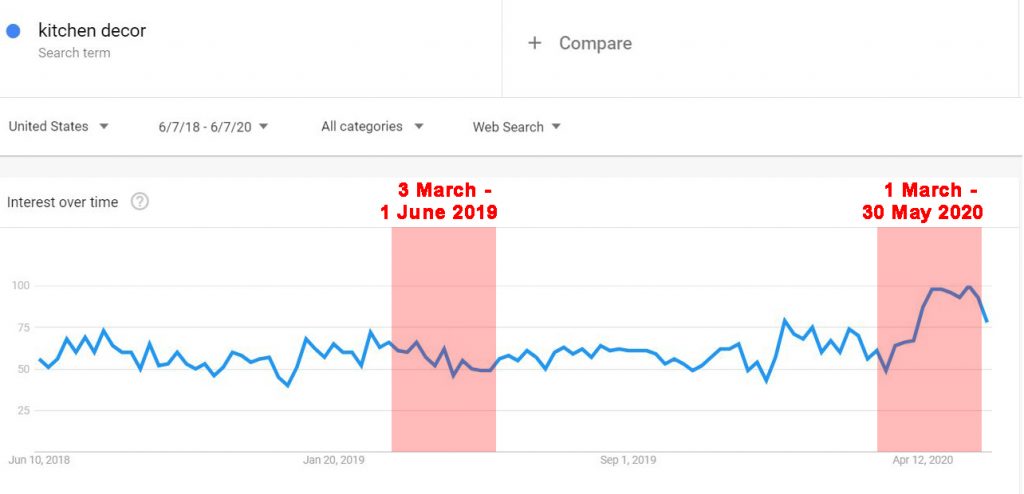
I tested other terms as well. It does seem like the niche had a strong “corona effect” going on. While still not back to normal, the direction is clear.
I won’t bore you with more Google Trends screenshots. I checked many terms for all of my niches. My conclusions so far –
Gardening terms spiked in the spring of 2020. They are still higher for this time of year (compared to previous years), but they are going down.
Home improvement queries show a similar pattern. Not as dramatic as with gardening, but goes along the same lines.
Automotive search terms went down in March, compared to previous years. They began to recover in early April and completely rebounded by late May, around Memorial Day, and seem to be going back to “normal.”
Travel queries are a mixed bag. International destinations (for Americans) tanked in March and still haven’t budged, which makes sense, considering the state of international travel. However, local US destinations show a different pattern. They too went down in March, but they’ve been making a slow – yet steady – recovery since mid-May.
Fashion and style search terms are interesting. They dropped in mid-March, and then a few weeks later, they began to climb up again. Still much lower compared to their correlating 2019 numbers.
As for pets, there’s a sharp short decline in March, but it seems to have corrected itself within a couple of weeks. Some terms went up after that. Others did not.
So, what does this mean?
I started this little project because I wanted to have a better understanding of my traffic stats for May. They seemed too good to be real. By that, I mean they were too good for the organic growth rate I would expect based on content production.
I wasn’t pleased with the sharp increase in revenue.
My husband is an operation researcher by trade and a spreadsheet wiz. When we launched this business two years ago, we created a proper business plan, along with a complicated spreadsheet that predicted our revenue and profit, based on the production rate.
Every month, we check the revenue and profit and compare them to the predictions in our spreadsheet. We’re usually on track or slightly ahead of the timeline. That’s because our estimates of RPM’s and traffic per post were accurate, and we keep adjusting them as we move along.
We base our projected revenue on the number of older posts that we have. The spreadsheet keeps count of how many posts we publish each month and calculates how many posts we had published, going six months back (i.e. we count only posts that are six months or older). Posting around 150 posts a month, we generally expect revenue to grow by just over $1000 every month.
In May, revenue took a HUGE leap.
Revenue grew not by $1,000, or $2,000. It grew by almost $4,700. Way too much.
Now, keep in mind that our spreadsheet doesn’t take seasonality into account. We’re not really expecting an even growth throughout the year, though. Not only is traffic seasonal in many sites, but RPM rates also change across the year. In a typical year, I wouldn’t be surprised to see an increase of $2,000 in May and June. It would balance out with smaller growth numbers in January.
Clearly, this year is anything but typical. And looking at Google Trends, I think it’s safe to say that the increase was in large part due to COVID-19 traffic trends.
Will revenue go down now?
No one knows what the future holds, but that doesn’t stop us from trying to make assessments.
The growth rate that we saw in May is hardly sustainable. I’m not going into the whole “pandemic analysis” thing again. I’m just saying, there’s a limit to how much people can garden, decorate their home or eat chocolate cake, in the long run. The trends we saw in May are already weakening.
If we’re lucky, we may still see an increase in revenue this month too. The following factors can contribute to an additional increase in revenue –
- Traffic still being higher than usual in the home and garden niches.
- Traffic improving in the travel niche.
- Most importantly –
- Continued growth in content
- Improved monetization efforts
I elaborated on our traffic and monetization projects in the May report, so I won’t repeat that here.
My point is –
I would be ok with no increase in revenue in June.
Even with a slight decrease. We weren’t expecting income to go above $12K before August. To see it in May was pretty awesome. But even if we go down now, it’s going to be ok – as long as I see it building up towards the $12K point in August-September.
As always, I would love to hear from others. What kind of trends did you see in May? How’s June going so far? Please mention your niche because it seems to matter a lot – now more than ever.
My site about boating and RVing has also gone up wayyy to much in May for it to be “normal” Definitely som Corona-effect there.
My pets site has grown a lot since the pandemic start and its starting to decline a bit again now.
My craft site also went up a lot in march/april but is dying down again…
Hi Morten!
Yes, crafts would be a classic “corona niche”. Don’t lose hope, there’s still at least one more year of the pandemic ahead of us 😉
Hey Anne,
Great site, and great results, thats awesome that you’ve made decent bank in May. You’ve made me want to look at my content websites again. I’ve been focusing on drop shipping and ecommerce stores for the last 6 months with improving results.
Is there a cap to how many sites you think you might end up with… ?
Looking forward to seeing June’s results
Hi Darren,
That’s a great question. Assuming 150 posts a month, the number of sites is a function of how large we want the sites to get – and how fast. That’s basically why we’re staying at the current number for now. Spreading our content production scope across too many assets means growing each one at a slower rate. And I’m seeing now just how important the size of a site really is. Not only does it help generate authority and traffic, but it can also help increase RPM’s. So, with that in mind, I’m trying to push my sites to the 1000+ posts range now. Which means focusing a bunch of existing sites, rather than adding new ones. As for a final cap – that would depend on the size of the organization, but I think 10-15 is a great range. Assuming someday we’ll be able to produce ~300-500 posts per month and grow them all at a good rate.
WOW, 1000 + posts. You’ve really driven something home for me. To create a authority website that makes ROI. You need to create deep valuable content that matters.
I’ve been going back and looking at someone my content sites, with 25 – 50 articles. Thinking yep, got lots more work to do.
The ecommerce sites I have I work on maintaining an average 300 products and 2 niche content articles a week. That seems to be working ok.
Huge fan… keep up the great work