Some posts only go to subscribers via email. EXCLUSIVELY.
You can read more here or simply subscribe:
Traffic growth patterns: Is there always a hockey stick? (And the July report)
I often read in forums about that a “hockey stick curve” that’s supposed to happen with a new website.
Sometimes, when traffic finally begins to grow, new publishers are disappointed and even worried because they’re not seeing that expected sharp angle.
If you’re taking your first steps in this business, and your site’s traffic growth isn’t “curvy” enough, fret not. None of my sites ever experienced a “hockey stick curve” growth either. And they seem to be doing just fine.
In fact, the sites finally broke the 2 million monthly pageviews point in July! More on that in the mini report section further in this post.
Table of Contents
- What is the hockey stick growth curve
- My “real life” growth charts
- How to get a hockey stick traffic chart
- Hockey sticks in Established Sites
- Site Flipping and The Easy Wins Database
- The July 2021 Traffic and Revenue Report
- Full steam ahead
What is the hockey stick growth curve
The term “hockey stick chart” or “hockey stick growth” isn’t unique to web publishing. Essentially, it describes a growth chart that looks a bit like, well, an ice hockey stick.
A hockey stick chart is a price line chart in which a sharp increase occurs suddenly after a short period of quiescence or relative stability. The line connecting the data points thus resembles a hockey stick.
Investopedia
They go on to describe this growth pattern as “explosive” and “dramatic”.
This is what a typical hockey stick curve looks like:

There’s a period of a lull… the base of the stick, and then, boom! Traffic explodes over a short period of time. It does look a lot like an a hockey stick.

If you’re just starting out and have a new site, I bet you’re anxious to get to the stick handle part. That crazy “explosive” and possibly exponential growth. From poverty to richness almost overnight. From famine to feast.
I’m sure some website owners see just that. Well, at least, I’ve heard of it, and have no reason to assume anyone was lying.
It just never happened to me with any of my websites. And I wanted to put that out there, in case it hasn’t happened to yours and you’re worried that there may be something wrong.
As always, this blog is based on my own experience. I strongly believe in the saying “your mileage may vary” when it comes to web publishing. I can only share what I know and have seen, so please take this information in the spirit in which is it given.
My “real life” growth charts
I went back to check on a few of my sites when I sat down to write this blog post. What I did was to take screenshots of the GA traffic charts for each site.
Here’s what it looked like for our largest blog. Launched in early 2019, the site now has more than 800,000 monthly pageviews.
I started with a daily chart. As you can see, we had one instance with a sharp spike. That was the time when one of the posts was featured in Google Discover.
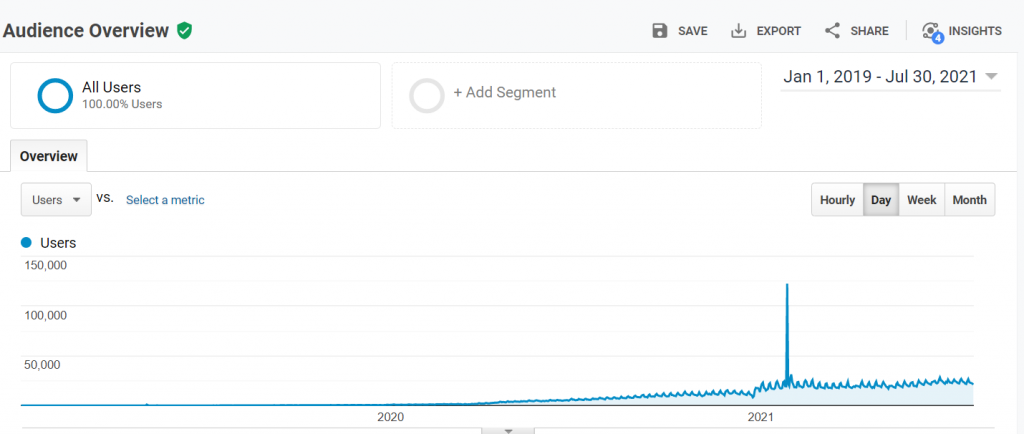
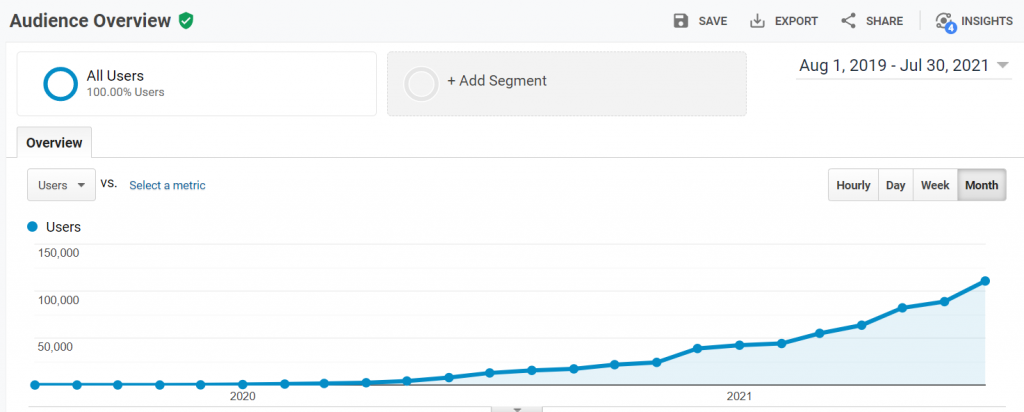
Keep that in mind when you take a look at the same traffic levels, using the monthly view –
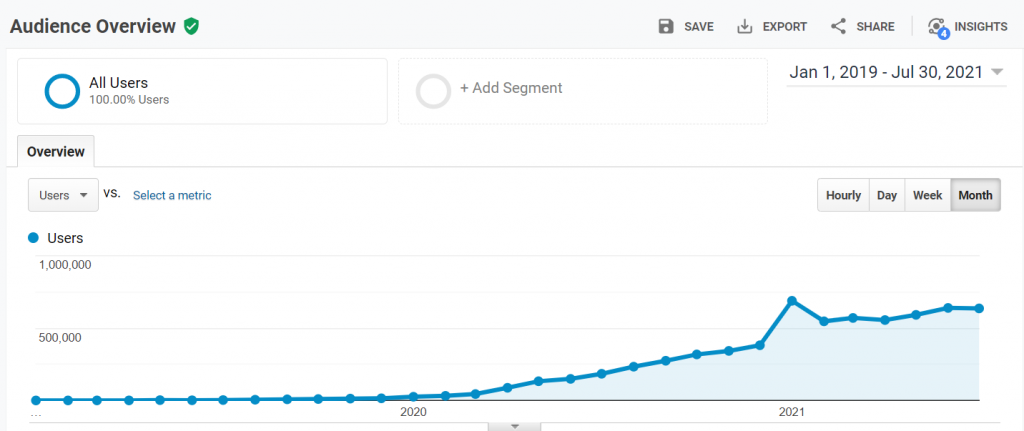
If you ignore that Google Discover spike, you’ll see that there’s no hockey stick. At no point was there a “sharp” or dramatic increase.
Yes, traffic is almost indiscienrable during the first year, or at least first 9 months. Then it begins to grow. At no point is the angle even vaguely reminiscent of a hockey stick.
Once the site came out of the sandbox (and it had close to 200 posts at the time, mind), it kept growing steadily. Just a nice dull linear growth pattern. May it last for many years to come.
Here’s another example.
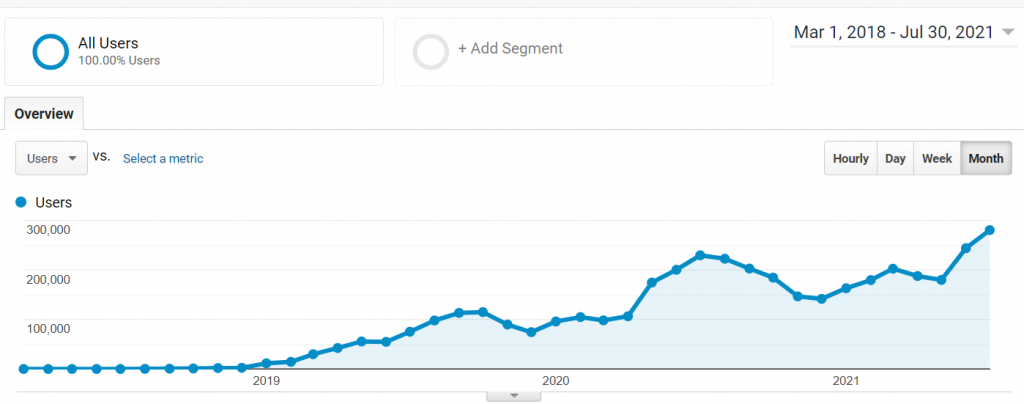
Again, once the site comes out of the sandbox phase (or whatever you want to call that initial phase – I know some people don’t like the term “sandbox”), we’re seeing linear growth.
Well, ok, in this case, it’s not that simple linear line. That’s because many of the topics on that site are seasonal. It’s always going to seem like a higher growth rate in spring and summer, and then a decline during the winter months.
But still no hockey stick at any point.
Here’s a different site. Because this site is still new, you get a better close-up on the pattern during the early days. It’s the same as I’m seeing with pretty much all of my sites.
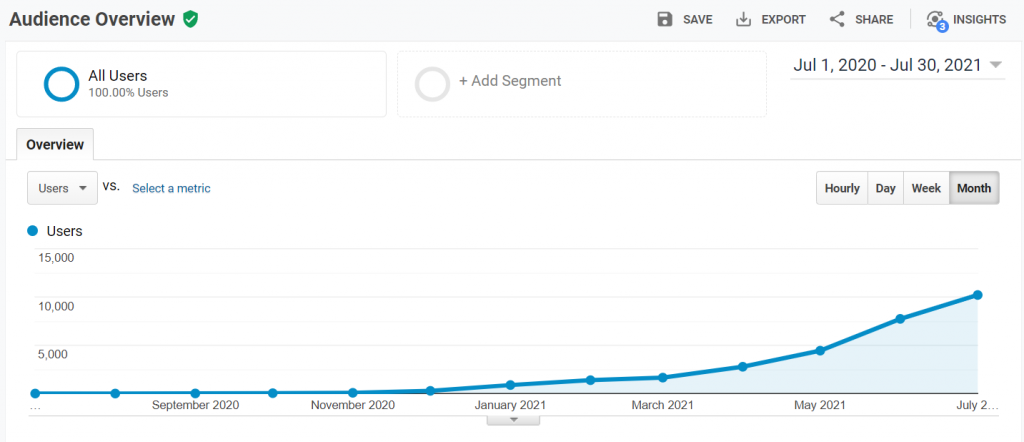
Following an initial lull, we’re seeing pretty much linear growth.Nothing explodes, nothing curves up dramatically. You’d have a hard time hitting the puck with this stick.
And one more –
Yup, pretty much the same old boring linear growth. I’ll stop boring you with screenshots now. Trust me, they all look pretty much the same.
How to get a hockey stick traffic chart
I have a theory as to why I’m not getting hockey sticks. I’d love to get some feedback on that theory in the comments, by the way.
My publishing strategy is not “hockeyish”
I think there’s merit to the idea of putting a bunch of articles on a site and then “letting it stew” its way out of the sandbox. In fact, that would be my strategy.
In theory.
In practice, I produce these new sites in batches, and with a limited budget in terms of the number of posts we can realistically produce each month.
I usually publish content on a new site at a regular pace of 20-40 articles per month (the exact number depends on available resources at the time).
Since I think a site should have around 200 posts to create a center of gravity, I get to that point around the time the site is already emerging out of the sandbox. Well, by then, there’s no point in putting it on the backburner. We just keep pushing out more content.
I wonder if that’s why we’re never seeing a hockey stick. Content production is continuous, so traffic keeps growing in a linear fashion.
Again, this is just a theory.
Another theory is that most people’s sites grow in the same linear way. And that hockey stick curve sites, are few and far between. Maybe it’s even another version of the survivor bias that’s utilized by some internet gurus to sell their courses?
If you can, leave me a comment to let me know if you’re seeing hockey sticks with your sites.
Hockey sticks in Established Sites
I wonder if maybe a good way to see a hockey stick is to create major “content pushes” focused entirely on a single site. I’m not about to test this theory because I want to grow all of the sites in my portfolio.
But it’s an interesting concept. And one that one can try with a nice site flip.
Which brings me to my next topic – a little shoutout for the best Flipper I know – and how you can learn from him. And no, it’s not Flipper the dolphin. Although I keep looking for those here in Florida (two sightings so far!)

Site Flipping and The Easy Wins Database
I consider site flipping to be an advanced form of making money from web publishing.
The general idea is simple enough: Buy a site, increase the revenue, then sell at a profit.
For me, that’s advanced because I think you have to know how to create a website, generate traffic and monetize properly before you take the leap into flipping sites.
Mushfiq, the man behind TheWebsiteFlip.com is a master of site flipping.
Not only has he successfully flipped more than 200 sites to date, but he also scaled his operation in quite an incredible way. Check out the blog above for fantastic content about flipping, managing and scaling. I learned a lot there.
And here’s a shoutout for his info product too. Mushfiq created a cool database with hundreds of techniques that he routinely uses to generate more traffic and revenue.
It’s basically like a huge checklist that can be easily applied to any website. For each item, you can check whether it’s been used on your website. If not, consider giving it a try.
Each item in the database is classified by how effective it’s likely to be, as well as how easy or difficult to employ. The idea is to find the changes that are “Easy wins”. Where a small change could make a big difference.
With that in mind, the product is actually called “Easy Wins”. Check it out here. You don’t have to be a website flipper to benefit from it.
The July 2021 Traffic and Revenue Report
And now, to the report.
It’s a mixed bag, in a sense. The bad news is that revenue has not grown, but instead declined a little. This is the first time this has happened since January and February (typically the worst months of the year for revenue).
The good news is that traffic has increased. And also, that I know exactly why revenue is down, and so I’m not too worried about it.
Let’s take a closer look at the numbers.
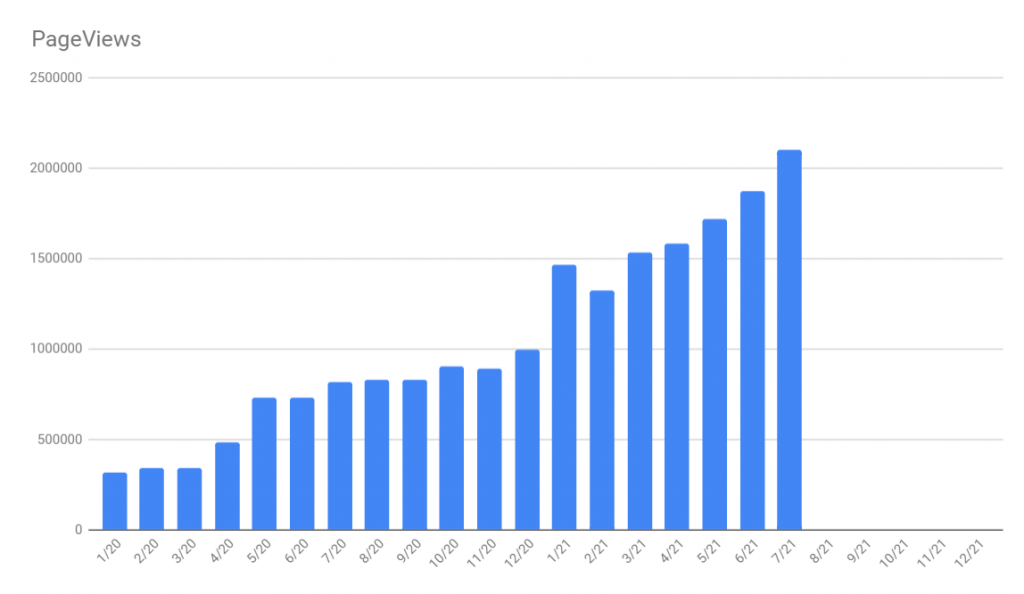
Traffic on the niche/content sites went up by about 12% from 1,875,652 to 2,103,744 pageviews. We have an additional forums site that we’re keeping out of this chart because it has different traffic patterns. That site brings in an additional 1.3 million pageviews every month.
As for revenue, we went from $85,105 to $83,783. That’s a decrease of around 2%.
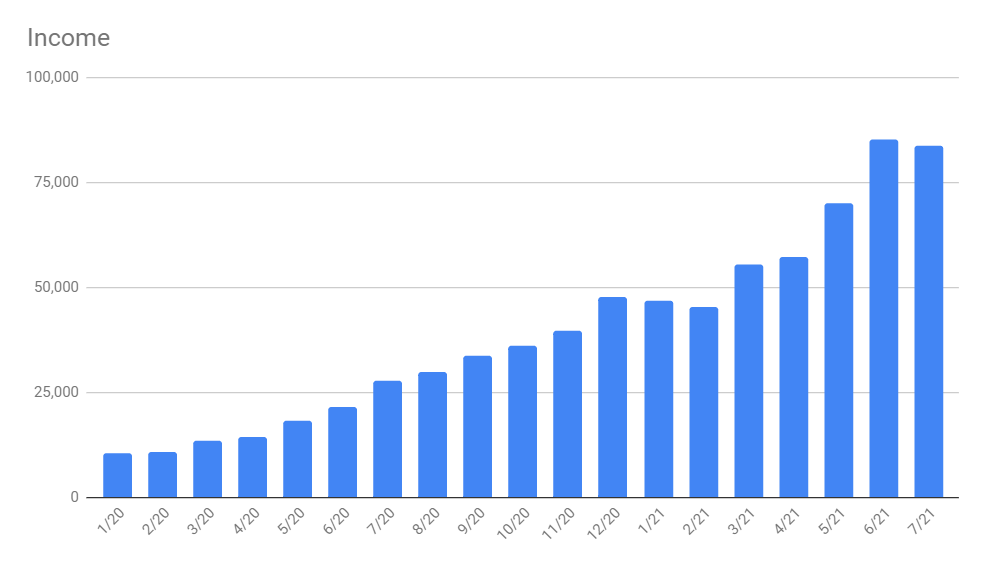
Why did revenue go down instead of up?
Well, it’s actually’s June’s fault. Take a look at the chart above. July actually looks great when you look at the bigger picture. The anomaly lies with June.
Not only did June have higher RPM rates (because it’s the last month in the quarter), but it also had Amazon Prime Day. Combine the two, and I would say they account for around $5000-$7000 of June’s phenomenal revenue numbers.
Our expenses in July
As always, this section is more about estimating our costs than tracking actual expenses.
I put the production per post costs at $70 per post. That number includes writer fees, editing fees, and VA fees. We published a total of 554 posts in July (that’s a record for us!), putting our content investment expenses at $38,780.
As usual, I prefer to add around $3K in general expenses. That’s on top of the cost of each post. It’s probably a bit too much, but I prefer to err on the side of caution.
That brings us to a total of $41,780 in expenses.
The Bottom Line
$83,783 in revenue and $41,780 in expenses brings us to a total of –
$42,003 in profit
This is after a larger than ever investment in content.
That’s about $8,000 less than what we made last month, but considering the June revenue anomaly, and the increased investment, I’m very happy with these numbers.
Full steam ahead
August is proving to be another super hectic month. We’ve settled in, pretty much, and now that I have a desk, a chair and a new laptop, it’s work, work, work…
We are in a new place, and Florida is gorgeous around these parts. It’s so pretty here, that we can actually limit our sightseeing to our town (Indialantic). This evening, for example, we watched manatees in the river, just 400 yards from home. Last week we got to see baby sea turles hatch and make their way to the ocean. And that’s just 600 yards away from home in the other direction!

We’ll save the longer trips to the cooler winter season, and in the meantime, I’m enjoying the local area and focusing on work.
With that in mind, no promises on another post this month. I do try to check in as often as I can to reply to comments, to if you have any, let me know!
Thanks Anne – Glad you are getting settled – God Bless Greg & Darlene
The only people I ever hear about hockeystick growth is people who are trying to sell the idea that blogging is easy (looking at you, Income School). Your post was a great reality check. While I don’t have anywhere near your numbers, for me it all looks the same as well. >200 posts published slowly over time, and linear growth all the way to >60k pageviews/mo.
Never saw hockeystick growth.
I’m glad I’m not the only one seeing this, Hugo. Thanks for chiming in!
Hi Anne, great update, thanks for sharing.
Question, how many writers does it take you to produce 554 posts in a month? I’ll be greatly increasing content soon so it’ll be good to hear. Thanks.
Hi Shaun,
I must have missed this comment before, sorry about the late response.
We’re actually up to 601 posts in August! The number fluctuates from time to time, but I just checked and we’re currently at 85 freelance writers on Clickup.
Your progress is really inspired. Can you make a post about managing writers, VA and other people involved in your business and what tools do you use? I am a publisher from Europe in different language, mostly Spain, but managing people is too hard. Thank you
Hi Lucass,
I wrote about that in my post about Clickup. That’s the platform we currently use to manage everyone, and I shared my workflow there too. I hope this helps!
1) what does the editor do and what does the VA do?
2) what keyword research strategy do you use? I can’t find any articles about this on the blog.
3) what kind of guidelines do you give your writers?
4) how do you decide if a project failed?
Hi Champ,
These are big questions. Each one is probably worth a post… And fortunately, some of them I’ve already written.
1. The editor goes over the text and edits. The VA’s add media and publish. See our workflow here.
2. I employ a variety of keyword research strategies, but mostly the alphabet soup. I basically follow a lot of what the Fat Stacks course teaches. Some with my own seasoning.
3. I explain some of that in this post. I don’t share all of them though – there’s a limit to what I’ll share in a free blog 😉
4. Great question. There’s also the follow-up question: what to do if I decide a project has failed. The answer is that it’s relative. Some sites do better than others, so we add more to those sites and halt production on the ones that have a lower RPM or traffic stats. I’m not sure I would consider them “failed” sites though. They’ll still return the initial investment and probaly turn a profit.