Some posts only go to subscribers via email. EXCLUSIVELY.
You can read more here or simply subscribe:
February 2020 Traffic & Revenue Report
I began writing this post on March 1st. This was the original intro I had in mind –
February had 29 days this year – being a leap year – but it still felt short. With the month finally over, it’s time to check the numbers. The bottom line is actually sort of boring – more gradual growth on all fronts. And the emphasis is on gradual. We are still on track with our timeline predictions, but I confess, I could use a boost of surprise traffic/revenue to add some excitement. There’s not a whole lot of dopamine in gradual growth.
And no, I’m not complaining. This business – or any business for that matter – can be volatile at times, so positive growth and stability are welcome. Just not really interesting.
I was going to wrap up the post within a day and publish it. A lot has happened since then, both globally and for my business. No dopamine, but boy, a lot of adrenaline!
Contents
Quick update before the report itself
Two things have kept me very busy and distracted over the past week.
Changes with my flagship site
First, my flagship site needed urgent attention. That site (not covered in this traffic and revenue report) is the cornerstone of my online business. It’s a community (forum) site that requires more work than a blog or niche site. Both in terms of platform and server maintenance, and in terms of community management.
Three years ago, I outsourced most of the work to a company that specialized in forum management. That allowed me to focus on my niche sites portfolio. On March 2nd, I received an email from that company, letting me know that they decided to part ways. They’re adjusting their business strategy and, won’t be working with us anymore. While they gave me until the end of the month before switching off all services, they wanted to start rolling back some of them right away. I decided against hanging in there with partial services for a full rate and told them that we’re ready to cut the cord right away. And we did.
That meant I had to roll up my sleeves and jump right into things. I took over some of the routine maintenance chores while looking for other outsourcing options. I won’t bore you with the details. Suffice to say, the first few days were very busy and stressful. Fortunately, the trip we had planned for March had just been canceled so at least I was there to handle everything myself.
Which brings me to the next issue, which may be more pertinent to other site owners.
Covid-19 broke into our lives
Like most people, I’m still grappling with the pandemic. I’m a bit of an epidemiology nerd, myself. A few years ago I took a course in epidemiology and fell in love with the field. I’ve been following the corona reports closely for several months. About two weeks ago, it became fairly clear that this is it. It’s the big one. And it’s going to change everything, including the economy and our own industry. On a personal level, it got us to cancel our trip to Florida.
I could write more about this, but this is my report about February’s traffic and revenue. I do plan on dedicating a post to covid-19’s effect on our industry soon, so stay tuned. This is a good place to mention that I’ve added signup boxes for the Yeys.com mailing list. Just scroll down to the bottom of any post in this blog and enter your email. It’s a double opt-in, so check your inbox for the confirmation email.
I just mentioned Covid-19 here to explain why the report is coming out later than usual and to let you know that our Florida trip had been canceled. Now, back to traffic and revenue.
So what is this report?
Here’s a quick recap about these reports. I have a portfolio of content/niche sites, some of which were launched in 2018 and some in 2019. This blog – Yeys.com – is where I document my progress in detailed traffic and revenue reports. I started doing this in 2019. You can find the previous reports here.
Note: I have another large site that isn’t covered in these reports because it’s a community (forum) site. I try to keep Yeys.com dedicated to my content sites venture. If you’re a newbie reading this, please keep in mind that I am an experienced web publisher and have a constant stream of revenue which allows me to invest in new websites.
My Web Publishing Strategy And Our Team
My strategy is simple –
- Find underserved queries on the internet.
- Publish the best possible answer to the query.
- Monetize.
Multiply this by dozens of posts a month, across several niches, scaling up by outsourcing. I currently employ four full-time VA’s, two part-time editors and a server admin on a monthly retainer. That’s the core of my team.
In addition to that, I work with 20-30 freelancers that write a total of 150+ posts per month. (If you’re curious about how I manage post creation, you can read here about my workflow).
My husband also helps, especially with strategy and analysis (that’s on top of his day job). That’s why you’ll see me using “I” and “we” interchangeably.
Introducing our portfolio
Our current strategy goes like this:
- Add one content site to the mix every quarter, launching it with 100 posts.
- Let it brew for an additional half a year, to see how the niche feels.
- If it’s going well, keep pushing content and making it into a large authority site.
- If it doesn’t – no harm done, we have a smallish site in the portfolio that will pay for itself within a couple of years.
So, this is where we stand now –
(Potentially) Large niches sites
- Travel
- Automotive
- Home Improvement
- Gardening
- Finance
- Style and fashion
Small niche sites
These were “carried over” from previous years before we devised the current strategy.
- Pet Accessories blog (a specific type of accessories)
- Pets blog (specific small pet)
Traffic and Revenue for February 2020
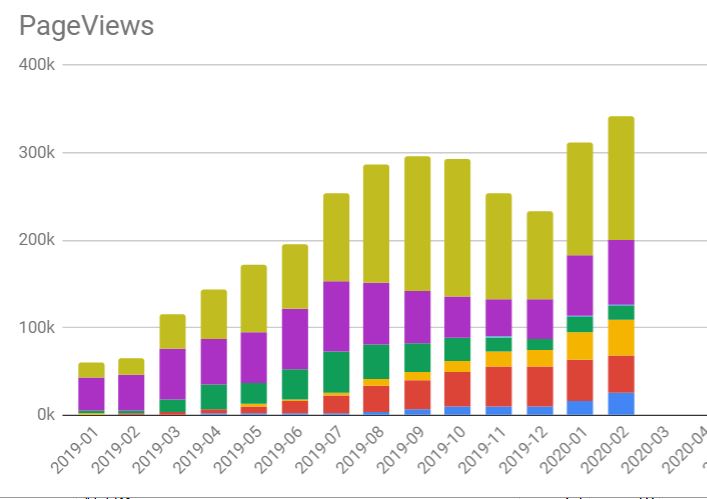
Taking into account our entire portfolio, we had a total of 342,193 pageviews. Compared to 311,132 pageviews in January that’s an increase of almost 10%. It’s actually a prettier picture if you take into account the length of each month. Daily average traffic was 10,036 in January and 11,799 in February, making this an increase of 17%.
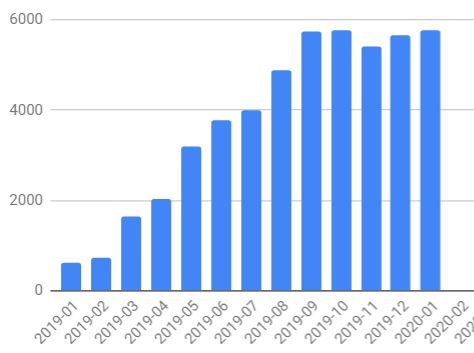
Unfortunately, revenue was only marginally up, at a total of $5,765. Again, this is partly due to the shorter month but there have been issues with a couple of the sites that hurt revenue too (more on that later).
Let’s take a look at the numbers per blog.
The Travel Blog
This site was established in June 2016. I try to keep a personal tone in this blog, so while outsourcing the bulk of the writing, I’m the one writing the outlines, intros, and summaries for most of the posts. This slows down production, as I don’t have the time to deal with too many posts to that extent.
As for monetization, about 75% of revenue comes from display ads, managed via Ezoic. The rest is a combination of Amazon and Booking.com affiliation fees.
The blog currently has a total of 236 posts.
Traffic kept growing in February, though not at the same speed as it did in January. Revenue went up as well.
I’m fairly certain we’re seeing the effects of covid-19 in action here. I can already tell you that traffic has been declining in March. And for good reason. Just like us, many people canceled all trips. I’ll discuss this in more depth in my post about coronavirus but clearly, the entire travel section is going to go down.
This is one of the worst niches to be in right now. Fortunately, we’re evenly spread out across niches.
The Automotive Blog
We started this blog in April 2018. The niche covers vehicles of various classes and types. The content is mostly informational with a few “best X of Y” product lists.
The site makes about 75% of its revenue from display ads and 25% from Amazon affiliate links.
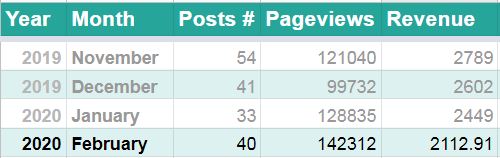
This blog currently has 616 posts, making it the largest in our portfolio. However, many posts are fairly young.
In February, blog traffic kept growing slowly, reaching 142,312 pageviews.
Revenue actually kept going down, hitting to $2,112.91
So, what happened to our revenue? After some more issues with Ezoic, the site was offline for a few hours at a time, on especially busy days. We can’t afford to have downtime, so eventually, I took the site back to Monumetric. That downtime and the move itself meant we lost a total of a couple of days worth of revenue. And of course, February was a shorter month than usual. So, while disappointing, there are some extenuating circumstances.
The Home Improvement Blog
This site was launched in early 2019. The posts are a mix of informational and “how-to” posts, with inspirational picture posts and a few “X of Y” shopping guides. The site is monetized with display ads (Ezoic) and Amazon.
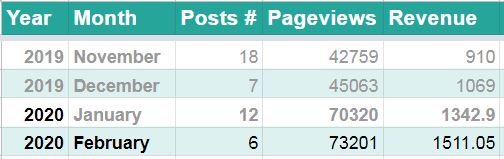
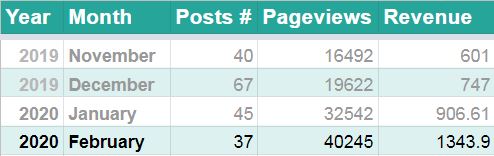
Traffic to this blog went just over 40,245 pageviews in February.
The blog currently has a total of 459 posts but traffic isn’t as high as you’d expect, considering that number. We expect to see at least 250 pageviews per mature blog post. So, with 459 posts, we should be looking at well over 120K monthly pageviews. The number is lower, partly because a large amount of posts is still too new.
The good news is that we had an increase in revenue, with a total of $1343.90
The Gardening Blog
This site was technically launched in September 2018 as a micro-niche site but was moved to a new domain in April 2019 when we decided to cast a wider net and turn it into an authority site. The content so far has been a mix of response posts, gardening guides, inspirational photo posts, and some “Best X for Y” product posts.
The site is monetized with display ads and Amazon. The blog currently has 276 posts.
Traffic kept increasing in February reaching a total of 24,969 pageviews. However, revenue fell down to $148.19.
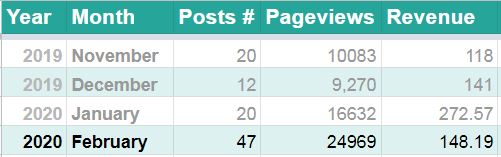
Basically, what happened was that we lost our display ads. It’s an interesting story, so I’ll share it here quickly. The site had been monetized using Ezoic for display ads. They contacted us in early February, claiming that there is suspicious traffic coming from that site. They wanted to know if we were buying traffic or somehow using bots. Obviously, we weren’t. Ezoic kept investigating, and wouldn’t even say what aroused their suspicion. We checked things on our end – everything looked kosher. No spikes in traffic, just a nice growth curve coming mostly from SEO traffic. Like all of our sites.
After further investigation, Ezoic said that they were sorry but they can’t keep showing ads on that site. Since we also had some issues with them on other sites, I didn’t mind taking the site off Ezoic. For now, it’s running Adsense which brings in pennies and making some money on Amazon too. We will probably deploy Mediavine there instead soon. Basically, there was too much going on for me to deal with it so far.
The Finance Blog
Moving on to the smaller sites. Launched in August 2019, this is an experiment in the YMYL field.
The site isn’t monetized (too small) and we’re working on getting it to the 100 posts point. The total number of posts at this point is 72.
Traffic is on the increase – very very slowly. We’re still in the sandbox with a total of 280 pageviews.
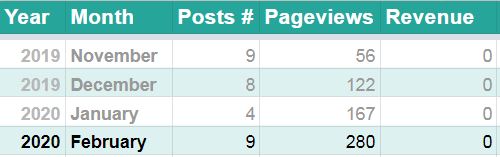
And if you’re wondering if that is normal for a site of this age, here’s the next site for comparison.
The Style and Fashion Blog
This site was launched in September 2019 (a few weeks after the finance site). The content is a mix of response posts, guides, and lists of inspirational images. The site is still in the sandbox, but it was created with Amazon links, so you could say it’s monetized that way.
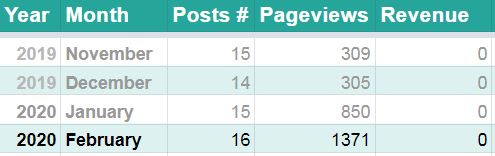
The number of posts now is 96. We’re only 4 posts away from getting to the 100-post point. That’s when we’re going to let it rest for a few months.
Clearly, the site is still in the sandbox with only 1371 pageviews in February. It’s interesting to see that it’s generating more traffic than the finance blog. I guess that’s the effect of the YMYL niche there.
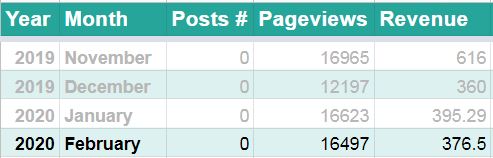
The Pet Accessories Blog
This site was launched in March 2018. It includes high-quality guides relating to aspects of the topic (how to choose, how often to clean etc). We also have some “X for Y” lists.
The site has 78 posts and hasn’t had new posts added in a while (working on changing that soon). This particular site was doing very well over the summer, reaching over 40,000 pageviews a month and generating more than $2700 in revenue during August 2019.
For some reason, it was hit during the October algorithm update and then again in November. December was pretty bad.
In January 2020, we were seeing the first signs of the site rebounding. It’s holding its own in February but not much more.
We plan on adding 22 more articles to bring it up to a total of 100. The first additional posts were published in March, so it should be interesting to see next month’s report.
The small pets blog
This site focuses on a specific type of small pet. It was launched in October 2018 and we built it up to exactly 100 posts (with the last posts added in April 2019). As for the type of content, it’s mostly response posts but there are some tip lists and “best X of Y” posts.
The site is monetized with a combination of display ads and Amazon links.
Traffic went down a little from 46,180 pageviews to 43,317. Considering this is a shorter month by a couple of days, it’s not very significant. Revenue increased just a little bit.
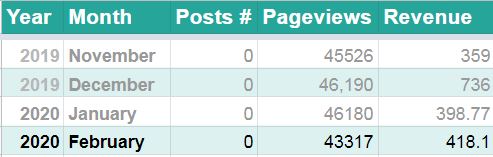
March should be interesting for this blog. I finally went ahead and moved it from Ezoic to Mediavine. I’m curious to see if they can get better RPM’s for it.
Expenses and Investment in February
Unlike with revenue, I can only provide estimates here. It’s just too much time and work to try and collect every little payment out there. So, this is currently our breakdown for a single month and I’ll be repeating it in future reports so if you read this once, it should be enough.
The exception here would be the cost of written content (how much we pay writers). That one I calculate monthly by taking the overall number of words that we published and multiplying that by 3 cents (which is how much we pay writers per word). We had a prolific month in February, increasing the number of posts and words significantly.
$250 – hosting expenses
$400 – Software (plugins, templates, task management, SEO tools, etc.)
$300 – Stock photos
$2,500 VA fees (four VA’s)
$9,00 Editor fees
$288 Ezoic premium fees
$7501 writers
That comes to a total of $12,139
The fiscal bottom line
We had a total of $5,765 in revenue and $12,139 in expenses. That means we “made” -$6374 in February. Still in the red, but that is actually still according to plan.
Final Words
So, there you have it. That’s our report for February.
We’re basically on schedule with our timeline, at this point. I am concerned about the future, due to the effect of covid-19 on the market. It’s a discussion for a separate post though.
As always, I love getting your comments, so don’t be a stranger! Let me know what you think by leaving a comment below!
Looking forward to hearing how your experience with the other ad networks go!
[…] Income Report – https://yeys.com/traffic-revenue-report-2-20/ […]
Interesting stuff!
Yes, it’s times like these that you appreciate diversifying!! May I ask do you still use Pinterest as a way of promoting each and one of your niche blogs and how many pins per post do you usually do? I read an older post you had on Pinterest…just wondering if its still part of your strategy? Also what stock photo provider do you use? Finally, just want to thank you Anne for your continued updates!
I should update that Pinterest post – thanks for the reminder.
Yes, we still create pins for each post and use Tailwind to schedule pins. However, I’m now trying the system set out in Jon Dykstra’s new Pinterest course. It emphasizes fresh pins and how to push them using “seo-like” techniques.
For stock photos, I went with the 750 monthly image subscriptions from iStockPhoto and DepositPhotos. That gives us a lot of of flexiblity with images for posts, and now for Pinterest.