Some posts only go to subscribers via email. EXCLUSIVELY.
You can read more here or simply subscribe:
August 2020 Traffic & Revenue report
In terms of revenue, August has been a "steady as she goes" month here. With some of the sites affected by seasonality, we've seen only little growth in overall traffic, but at the same time, an increase of 8% in revenue. Here's the detailed report.
August has been yet another crazy month here (the craziness is certainly spilling into September so far). In terms of traffic and revenue, August has been a “steady as she goes” month here. With some of the sites affected by seasonality, we’ve only seen little growth in overall traffic. However, at the same time, we had an increase of 8% in revenue.
At the same time, we’re in the process of increasing our monthly investment in content to $15,000-20,000 a month. With our kind of workflow, relying on in-house freelancers, that process is proving to be a considerable challenge. It’s been keeping my husband and me busy seven days a week for three weeks now. If we ever actually get this business to work, don’t let anyone tell you it’s easy *wink*
The work overload is still preventing me from posting here more often. I’m not sure if that’s going to change in the coming weeks. Yeys may be “downgraded” to reports only for a while. I’m active on the Fat Stacks forums, so if you want to read more, or generally network, look me up there. The board is open only to customers who buy any of the Fat Stacks courses. I have them all and can highly recommend them.
No time for chit-chat today, so let’s move on to the report. If you’re already familiar with my business model, use the table of contents to skip to the juicy parts or go straight for the bottom line.
Contents
What is this report about?
Recap: I have a portfolio of content/niche sites. This blog – Yeys.com – is where I document my progress in detailed traffic and revenue reports. I started doing this in 2019. You can find the previous reports here.
Note: I have another large site that isn’t covered in these reports because it’s a community (forum) site. I try to keep Yeys.com dedicated to my content sites venture. Keep in mind that I am an experienced web publisher and have a constant stream of revenue, which allows me to invest in new websites. This kind of investment is not something I recommend doing if you have no reliable source of income.
My Web Publishing Strategy And Our Team
My strategy is simple –
- Find underserved queries on the Internet.
- Publish the best possible answer to the query.
- Monetize.
Multiply this by dozens of posts a month, across several niches, scaling up by outsourcing.
We currently employ four VA’s and two part-time editors. In addition to that, we work with 30-40 freelancers that write a total of around 150 posts per month. We’re hoping to increase that number to 300 per month, and possibly more, in September. (If you’re curious about how we manage to produce so many content items, you can read here about my workflow).
My husband also helps, especially with strategy and analysis (that’s on top of his day job). That’s why you’ll see me using “I” and “we” interchangeably.
Our Portfolio
Here’s what our collection of sites looks like at this point.
These sites cover large niches, so they have a lot of growth potential. Some are already fulfilling that potential, having 500+ posts, and growing. Others are still at the sandbox phase.
- Travel
- Automotive
- Home Improvement
- Gardening
- Finance
- Style and fashion
- Kitchen
Small niche sites
These were “carried over” from previous years before we devised the current strategy. These sites are small and will remain small simply because of the scope of the niche.
- Pet Accessories blog (a specific type of accessories)
- Pets blog (specific small pet)
Traffic and Revenue for August 2020
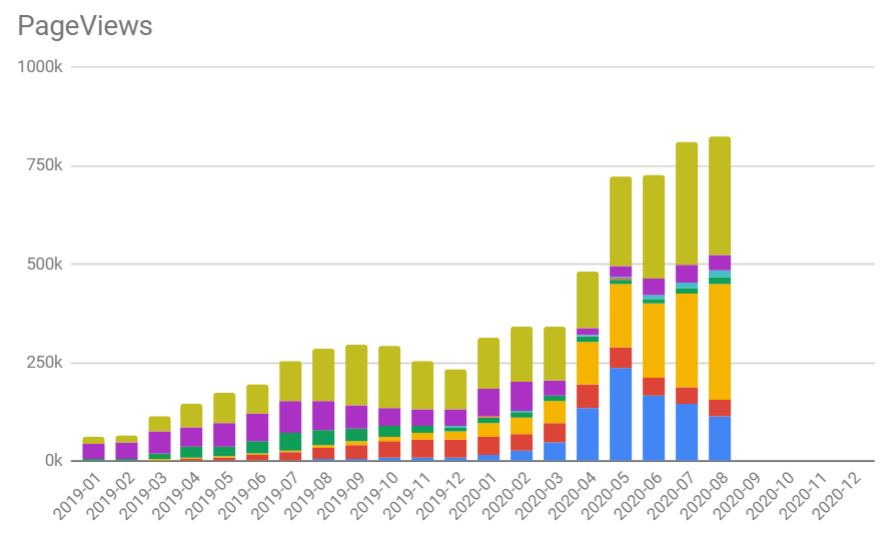
Taking into account our entire portfolio, we had a total of 824,563 pageviews. Compared to 811,857 pageviews in July, that’s an increase of only about 1%.
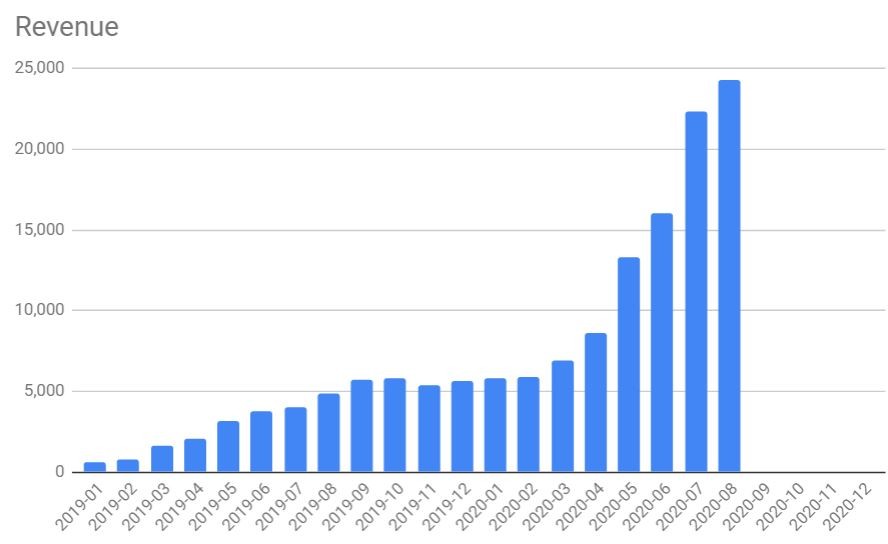
As for revenue, we made a total of $24,268 in revenue, compared to $22,339 in July. That’s an increase of about 8%.
While growth seems to be slowing down, we’re still seeing a positive direction. The bottom line – that of revenue – keeps growing at the expected rate, albeit not in the crazy (unexpected!) rates it had during the past few months. As for traffic, this was August, the last month of summer. Several of our sites have marked seasonality, so by mid-August, they began to decline in traffic. We expect a similar trend to continue all through to March, but hopefully, as we keep adding content, we’ll be able to offset at least some of the decline.
So, what happened here?
Let’s take a look at the numbers for August per blog.
The Travel Blog
Site history: We launched this site in June 2016. I try to keep a personal tone in this blog. While outsourcing the bulk of the writing, I’m the one writing the outlines, intros, and summaries for most of the posts.
Monetization: About 75% of revenue comes from display ads via Ezoic. The rest is a combination of Amazon and Booking.com affiliation fees.
The blog currently has a total of 248 posts. We haven’t added any content in July.
Travel traffic began to partially recover from COVID in June. Industry RPM rates are slowly climbing up again too. However, this niche is seasonal. Even without a global pandemic, traffic is starting to decline by the end of summer.
We’re still waiting for the vaccine to start pushing more content *wink*
The Automotive Blog
Site history: We started this blog in April 2018. The niche covers vehicles of various types. The content is mostly informational with a few “best X of Y” product lists.
Monetization: The site makes about 85% of its revenue from display ads via Mediavine and 15% from Amazon affiliate links.
This blog had 821 posts by the end of August, making it the largest in our portfolio in terms of content.
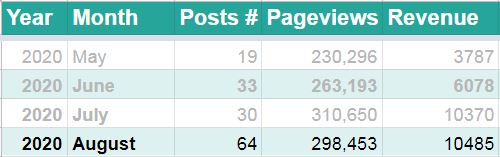
July was pretty awesome with 310,650 pageviews, but in August, seasonality in some silos began to kick in. We went down to 298,453 monthly pageviews.
RPM rates with Mediavine remained high, and we ended up with $10,485 in revenue.
The Home Improvement Blog
Site history: We launched the site in early 2019. The posts are a mix of informational and “how-to” posts, with inspirational picture posts and a few “X of Y” shopping guides.
Monetization: About 80% display ads via Mediavine and 20% Amazon affiliate revenue.
The site had a total of 724 posts by the end of August 2020.
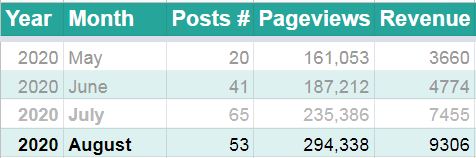
Traffic went up by 25%, from 235,386 pageviews in July to 294,338 in August. Revenue went up by a similar percentage from $7,455 to $9,306.
Finally, a niche that isn’t too seasonal. Whew!
The Gardening Site
Site history: This site was technically launched in September 2018 as a micro-niche site but was moved to a new domain in April 2019 when we decided to cast a wider net and turn it into an authority site. The content so far has been a mix of informational posts, inspirational photo posts, and some “Best X for Y” product posts.
Monetization: About 90% from display ads and the rest is Amazon affiliate fees.
The blog had 513 posts by the end of August.
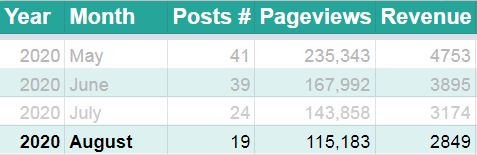
Still a downward trajectory here. From 143,858 pageviews in July to 115,183 in July. Revenue followed suit with a total of $2,849, down from $3,174 in July.
Gardening is a very seasonal niche. We expect traffic per post to keep doing down through to January.
The Finance Blog
Site history: Launched in August 2019, this is an experiment in the YMYL field.
Monetization: None. The site is too small, and the traffic is too low. It does have some Amazon links in posts but not enough traffic for generating commissions.
The total number of posts remained 91.
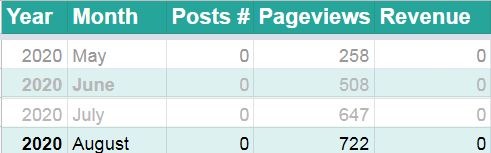
We considered selling the site, but with no revenue, it’s going to be sold as a “starter site,” making it difficult even to recoup the cost of content invested. Since it does not cost us anything to keep the site, we’re just letting it sit there. As you can see, traffic is growing – very slowly. I’m just curious to see what happens over the next few months.
The Style and Fashion Blog
Site history: This site was launched in September 2019 (a few weeks after the finance site). The content is a mix of response posts, guides, and lists of inspirational images.
Monetization: No display ads. Amazon links on some pages.
The site had 160 by the end of August.
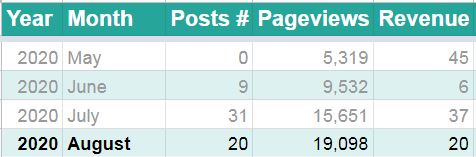
The site had 19,098 pageviews in August, compared to 15,651 in July. That’s an increase of just over 22%.
As for monetization, only $20 in Amazon this month. We added Ezoic a couple of weeks ago, but still have to tweak that account a little bit. There are a few bucks there that weren’t included in the report. Initial RPM rates are very low so far, but my Ezoic rep gave me some suggestions for necessary tweaks. I’ll apply them this week and see what the effect is.
The Pet Accessories Blog
Site history: This site was launched in March 2018. It includes high-quality guides relating to aspects of the topic (how to choose, how often to clean, etc.). We also have some “X for Y” lists.
Monetization: Display ads by Ezoic account for about half of the revenue, with Amazon bringing in the other half.
The site currently has 80 posts.
Stable traffic in August, but I confess, this site is sorely neglected. We need to audit existing content (I have this nagging feeling that we’re miscounting the posts, and there are only ~50 published posts). We also need to look into the Ezoic settings and see if something can be improved.
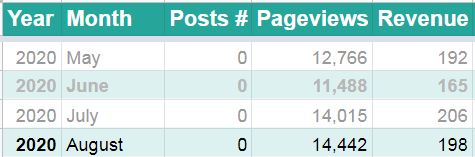
The small pets blog
Site history: Launched in October 2018, we built this site up to 100 posts (with the last posts added in April 2019). As for the type of content, it’s mostly response posts, but there are some tip lists and “best X of Y” posts.
Monetization: The site is monetized with a combination of display ads via Mediavine and Amazon links. About 50% of the revenue comes from each of these channels.
The site has 100 posts.
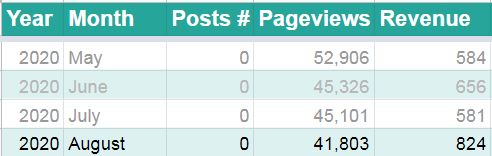
Another drop in traffic in August: from 45,101 pageviews to 41,803. However, Mediavine came through with RPM’s, so overall, the site made almost $250 more this month.
The Kitchen Blog
Site history: The newest site in this bunch was launched in March 2020. The original plan was to build it up to 100 posts, going after long-tail response posts, with some tip lists and “best X of Y” posts. It’s doing much better than we expected, with actual search traffic coming in from the first month. With that in mind, we decided to keep pushing content.
Monetization: There are Amazon links in some posts but nothing else (it’s brand new).
The site had 154 posts by the end of August.
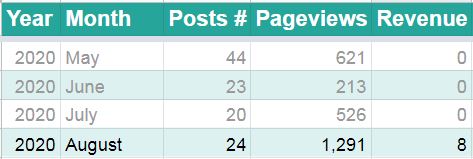
Nice growth here, but we’re still seeing sandbox numbers at this point. Still, it’s always exciting when a site gets its first Amazon commissions coming in!
Expenses in August
Here’s a breakdown of our expenses in August. By expenses, I mean the things that we would keep on paying, even if we stopped producing or promoting content altogether. The production and promotion costs we consider to be an investment that we can choose to make – or to avoid – each month.
- $100 – hosting expenses
- $400 – Software (plugins, templates, task management, SEO tools, etc.)
- $800 – VA cost for essential business management (I would keep this even if we stopped creating content).
That comes to a total of $1,300
Content Investment in August
Here’s how much we decided to invest back into creating more content. If we stopped creating and promoting content altogether, this would be money in the bank.
We produced 180 posts in August and increased the hours for our part-time editors.
- $300 – Stock photos
- $1,800 – VA fees (VA hours that go directly into content production and promotion)
- $900 – Editor fees
- $7,143 – writers (overall number of words that we published multiplied by 3 cents).
Total of content investment: $10,143 (compared to $9,000 in July).
The fiscal bottom line for August
We had a total of $24,268 in revenue and $1,300 in expenses.
That means we made a $22,968 profit in August.
We then invested $10,143 in content.
That leaves us with $12,825 “in the bank” by the end of the month.
We went up from $22,339 to $24,268 in profit. That’s an increase of about 8%.
As you may recall, last month I posted this in this section –
Our projections are for improvements in increments of $1500 per month moving forward.
So far, so good. August showed roughly that amount of increase in revenue. September may be a tad lower in revenue growth, but I’m hoping that the Q4, especially November and December, will make up for that.
What’s next?
In terms of revenue: steady as she goes.
We’re still expecting monthly revenue to grow by around $1,500 on average over the coming months.
As you may recall, we’re working on expanding our operations. We’re still shooting for 300 posts in September and possibly even a higher number in the coming months. Ultimately, our goal is to invest all of the profit back into content in the coming months.
I can already tell you that this is not easy to do. If you think that you can just turn on the tap and content comes out, well, that’s not how these things work. We’ve been focusing on two things for the last few weeks –
- We are recruiting more writers.
- We are fine-tuning our workflow and procedures.
It looks like scaling to the next level is anything but easy. We keep coming up with new features, ideas, and methods to streamlining everything. And there’s still a lot of work to be done. We use Clickup to manage the entire operation and get this – at every given day, there are over 1200 open tasks in our system.

It really is a lot.
Since the prospects are high – and getting higher – my husband has reduced his “day job” hours by half and moved to co-manage the business with me. His management and operations research skills are crucial for our growth. I’m immensely fortunate that we work so well together and that he’s enjoying the game as much as I do.
When people say that 2020 is a crazy year, I can only nod my head in full agreement. It’s been a crazy year for the entire planet, but it’s also super exciting and special for our little enterprise here.
Again, my apologies for not posting more often here. I do try to keep up with comments, so don’t be a stranger and let me know what you think!
Thanks for the motivation. This helps to keep us moving focused in the right direction. Just curious to know, what those colors mean in the graph “page-views”
Hi Meen,
I’m glad these reports help others 🙂 The colors represent the division between sites. I don’t really have a good reason as to why we only do that for traffic but not revenue. Generally speaking, revenue follows a similar pattern.
Thanks Anne – Appreciate you insights. Darlene and I just started Dec 2019 – had 4 sites – removed one – concentrating on three – Like you say Having Fun and learning alot – God Bless Greg – we are members of Income School and also fat Stacks.
Hi Greg! Sounds great – good luck with your sites and thank you!
I know you are busy people, but can you answer me some questions?
1) What kind of hosting do you use for your sites and do you use the VPS package?
2) How many articles do you writing for start building backlinks or do you use only Pinterest for traffic?
3) How many visits do you have to have per day on your site to start using earnings from paid advertising?
Thank you!
All the best 😉
Hi Peter, I’ll give it a go –
1) We currently use droplets from Digital Ocean. It’s a VPS package of sorts and only costs us around $40 for all of the sites. This is a non-managed solution so only good if you know how to admin a server or hire a server admin.
2) We don’t build any backlinks actively. We basically wait 9-12 months for traffic to begin.
3) At around 10K monthly pageviews we put Ezoic on the sites. At 50K monthly we put Mediavine. Amazon is there from the beginning.
I hope this helps!
Do you register new domains or buy dropped (expired) domains through auctions?
We only buy new domains. I like my domains fresh and clean, with no history of backlink building. I even check them in the Wayback machine to make sure they had no content on them in the past.
I have a question about time management.
Where did you find time with your husband to work on websites? I am sure that before Internet marketing you probably worked on a typical job that took up a part of your life.
Hi,
I’ve actually been self-employed for 20 years or so, involved in one way or another in web publishing. What really kept me busy during most of the time was homeschooling our kids. As the kids got older, I began to have more time to invest into the business (about 2-3 years ago) and this is the result. For a long while, blogging was something I did on top of my other business venues. For my husband, being involved in the business came in addition to his dayjob. The bottom line is, we’ve worked hard to get to this point. Some weeks, I was working 70-80 hours a week to cover everything. Not always easy (or healthy!)