Some posts only go to subscribers via email. EXCLUSIVELY.
You can read more here or simply subscribe:
May 2020 Traffic & Revenue Report
What an exciting month this was! I’ve been eager to write the report for May and share the good news! The bottom line is –
- Traffic increased by 52%
- Revenue increased by 54%
- We’re in profit!
Contents
If you’re already familiar with my business model, just use the table of contents above to skip to the juicy parts or go straight for the bottom line.
What is this report all about?
Recap: I have a portfolio of content/niche sites. This blog – Yeys.com – is where I document my progress in detailed traffic and revenue reports. I started doing this in 2019. You can find the previous reports here.
Note: I have another large site that isn’t covered in these reports because it’s a community (forum) site. I try to keep Yeys.com dedicated to my content sites venture. Keep in mind that I am an experienced web publisher and have a constant stream of revenue, which allows me to invest in new websites. This kind of investment is not something I recommend doing if you have no reliable source of income.
My Web Publishing Strategy And Our Team
My strategy is simple –
- Find underserved queries on the Internet.
- Publish the best possible answer to the query.
- Monetize.
Multiply this by dozens of posts a month, across several niches, scaling up by outsourcing.
I currently employ four VA’s and two editors (not all of them full-time). In addition to that, I work with 15-20 freelancers that write a total of around 150 posts per month. (If you’re curious about how I manage to produce so many posts, you can read here about my workflow).
My husband also helps, especially with strategy and analysis (that’s on top of his day job). That’s why you’ll see me using “I” and “we” interchangeably.
Our Portfolio
Here’s what our collection of sites looks like at this point.
These sites cover large niches, so they have a lot of growth potential. Some are already fulfilling that potential, having 500+ posts, and growing. Others are still at the sandbox phase.
- Travel
- Automotive
- Home Improvement
- Gardening
- Finance
- Style and fashion
- Kitchen
Small niche sites
These were “carried over” from previous years before we devised the current strategy. These sites are small and will remain small simply because of the scope of the niche.
- Pet Accessories blog (a specific type of accessories)
- Pets blog (specific small pet)
Traffic and Revenue for May 2020
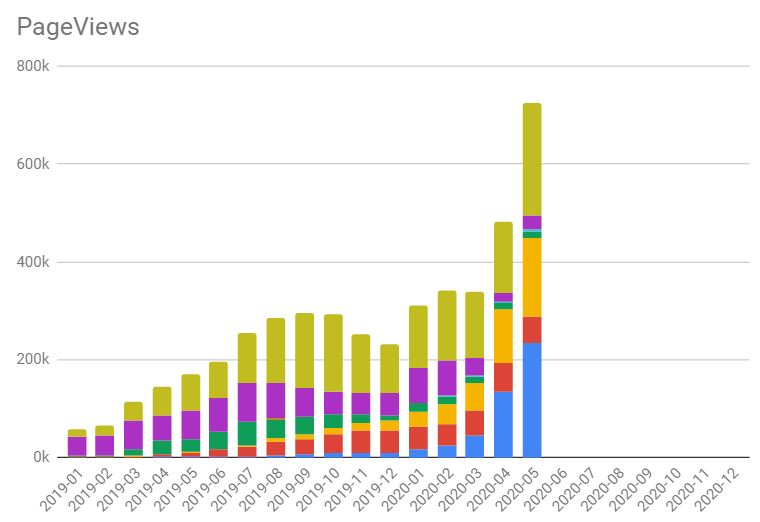
Taking into account our entire portfolio, we had a total of 724,836 pageviews. Compared to 482,046 pageviews in April. That’s a significant increase in traffic of about 52%!
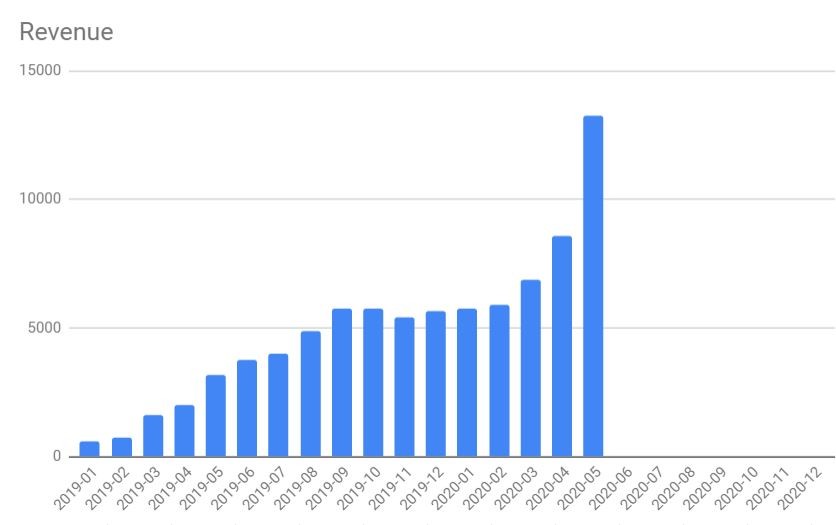
And this time, revenue followed suit. We made a total of $13,262 in revenue, compared to $8,573 in March. That’s an increase of about 54%, and yes, we’re finally making a profit! Woohoo!
So, what happened here?
We have three sites that are our “locomotives” at this point: Gardening, Home Improvement, and Automotive. They’re each at the 200K monthly pageviews zone. All three had a nice boost of traffic in May, accounting for the overall increase in traffic.
During the first three weeks of May, the gardening and home improvement site were growing like crazy. They have somewhat stabilized during the last week of April. On the other hand, the automotive site was down during March and the first half of May but finally began to climb again during the second half of the month. I’m guessing that people are coming out of lockdown. No more gardening and decorating – we’re back on the road. Just my guess – it could be something entirely different.
Let’s take a look at the numbers for May per blog.
The Travel Blog
Site history: This site was established in June 2016. I try to keep a personal tone in this blog, so while outsourcing the bulk of the writing, I’m the one writing the outlines, intros, and summaries for most of the posts.
Monetization: About 75% of revenue comes from display ads, managed via Ezoic. The rest is a combination of Amazon and Booking.com affiliation fees.
The blog currently has a total of 244 posts.
COVID-19 brought the entire travel industry to its knees, and travel blogs went down as well. It’s very easy to see the change in March.
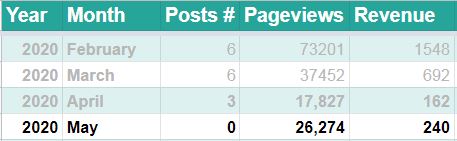
Some improvement during May, though. I stopped content production for this site in April but may get back to publishing during June, focusing on domestic travel.
The Automotive Blog
Site history: We started this blog in April 2018. The niche covers vehicles of various classes and types. The content is mostly informational with a few “best X of Y” product lists.
Monetization: The site makes about 75% of its revenue from display ads via Monumetric and 25% from Amazon affiliate links.
This blog currently has 694 posts, making it the largest in our portfolio in terms of content.
In May, traffic bounced back from the March corona slump. We reached 230,296 pageviews, compared to 144,455 pageviews in April. That’s a sweet increase of almost 60%! Revenue went up too and totaled at $3787 – compared to $2329 the previous month.
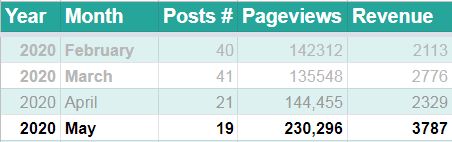
There’s some seasonality in this niche, as people spend more time outside during the warm months, especially with RV’s and bikes. We would typically be expecting traffic to start rising in March, but obviously, 2020 is not a typical year. Still, with more content ranking, and possibly people going out more, the site is doing well now traffic-wise.
Also, Monumetric added video content monetization in the middle of May – and that increased our RPM. They had informed me this was coming, so I was ready with video content, created using Animoto. Also, keep in mind that this niche wasn’t affected by Amazon’s commission reduction. It used to have a 4.5% commission, and as far as I can tell, it stayed that way.
The Home Improvement Blog
Site history: This site was launched in early 2019. The posts are a mix of informational and “how-to” posts, with inspirational picture posts and a few “X of Y” shopping guides.
Monetization: Approximately 60% display ads (Ezoic) and 40% Amazon.
The blog currently has a total of 563 posts.
Traffic kept shooting up! Traffic went up by almost 60%, from 108,321 pageviews in April to 161,052 in April. The revenue went up from $3,069 to $3,660.
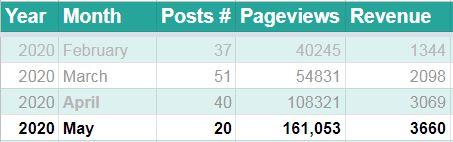
The reason for the smaller increase in revenue (compared to traffic) is two-fold. First, Amazon slashed the percentages for this niche, from 8% to 3%. Also, the site is monetized by Ezoic, and they don’t monetize video content, so their RPM rates are probably lower than what they could be. I hope to be moving this site to Mediavine sometime in June.
The Gardening Site
Site history: This site was technically launched in September 2018 as a micro-niche site but was moved to a new domain in April 2019 when we decided to cast a wider net and turn it into an authority site. The content so far has been a mix of response posts, gardening guides, inspirational photo posts, and some “Best X for Y” product posts.
Monetization: During March and most of April, the site was monetized with nothing but Google Adsense and Amazon. In the middle of April, Mediavine finally accepted this website. We now monetize with both Mediavine and Amazon.
The blog currently has 430 posts.
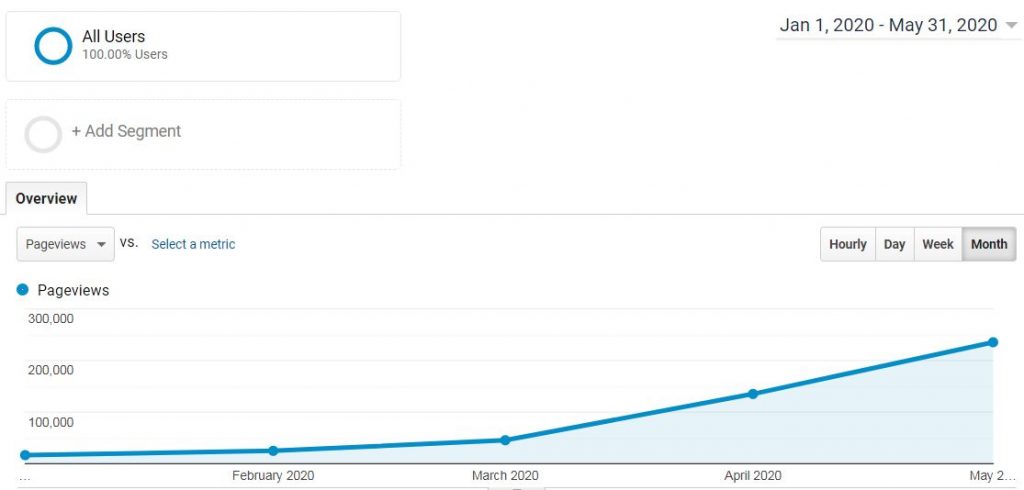
In the last report, I said that the site’s traffic had exploded in April. Well, May wasn’t too shabby either. We went from 135,198 to 235,343 pageviews! Revenue growth was even more impressive, with a total of $4,753, compared to $2,120 in April.
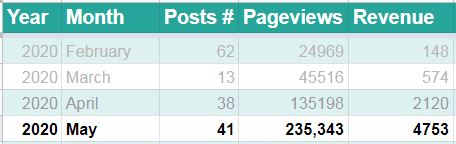
I think we’re seeing a combination of factors in play here. Traffic-wise, the site is finally out of the sandbox, and it’s also seasonal, with springtime being the best time of year for gardening. COVID-19 may also be playing a role here. Here’s a screenshot from Google Analytics, just because it’s such a lovely sight.
The Finance Blog
Site history: Launched in August 2019, this is an experiment in the YMYL field.
Monetization: None. The site is too small, and the traffic is too low. It does have some Amazon links in posts but not enough traffic for generating commissions.
The total number of posts at this point is 91.
I feel like saying, “move along, nothing to see here.” Instead, I’ll just copy and paste what I had said last month:
Clearly, this site is having a lot of trouble, but we’re not losing hope just yet. This site is an experiment, and we won’t know how it goes until at least a year from now. The small numbers, combined with the effects of COVID-19, make it difficult to assess what’s going on at this point. I’m pretty sure there’s a YMYL block in place too. Just look at the next site (launched at around the same time).
The Style and Fashion Blog
Site history: This site was launched in September 2019 (a few weeks after the finance site). The content is a mix of response posts, guides, and lists of inspirational images.
Monetization: No display ads. Amazon links on some pages.
The number of posts now is 100.
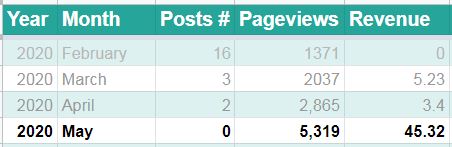
The site had 5,319 pageviews in May. That’s a good increase from 2,865 in April. As you can tell, there was some slowdown in traffic during April, probably due to people staying at home and spending less time (and money) on fashion. May was better, possibly in part due to a new Pinterest campaign we launched in the second half of May. I’ll talk more about the Pinterest Push later on, as we’re applying it to other sites as well now.
I’m happy with the monetization here too. The numbers are small, but they indicate a healthy $9 RPM from Amazon alone.
The Pet Accessories Blog
Site history: This site was launched in March 2018. It includes high-quality guides relating to aspects of the topic (how to choose, how often to clean, etc.). We also have some “X for Y” lists.
Monetization: Display ads by Ezoic account for about half of the revenue, with Amazon bringing in the other half.
The site currently has 96 posts, but 18 of those are relatively new.
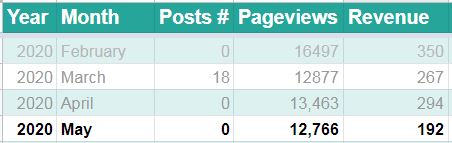
This particular site was doing very well over the summer, reaching over 40,000 pageviews a month and generating more than $2700 in revenue during August 2019. For some reason, it was hit during the October algorithm update and then again in November. Traffic has stabilized somewhat over the last three months, but revenue is dropping. We’re at an all-time low with just $192 coming in this month. Ouch!
It just doesn’t seem to be able to recover in Google. The content push we had in March didn’t help much either. We will try a Pinterest push next, hoping to see some effect in Google too at some point.
The small pets blog
Site history: This site was launched in October 2018, and we built it up to precisely 100 posts (with the last posts added in April 2019). As for the type of content, it’s mostly response posts, but there are some tip lists and “best X of Y” posts.
Monetization: The site is monetized with a combination of display ads via Mediavine and Amazon links. About 50% of the revenue comes from each of these channels. The site has 100 posts.
Traffic went down this month, from 59,426 to 52,906 pageviews. Revenue went down a little but not by much, staying at a stable $584.
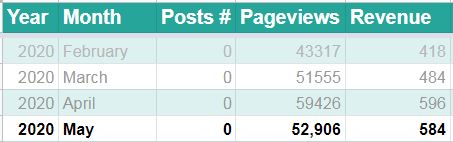
The traffic stats are encouraging because this website has been entirely passive during the past year. The last time we added content to the site was in April 2019. It’s good to see stability with a website at this stage. Also, with 100 articles at approximately $50 each, we are now at the breakeven point for this site. From now on, it’s 100% profit for a site that’s entirely passive to run.
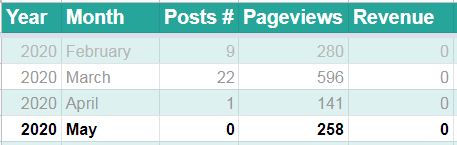
The Kitchen Blog
Site history: This site was launched in March 2020. The plan is to build it up to precisely 100 posts. We’re going after long-tail response posts, with some tip lists and “best X of Y” posts mixed in.
Monetization: There are Amazon links in some posts but nothing else (it’s brand new).
The site currently has 88 posts.
The site went up from 350 pageviews to 621.
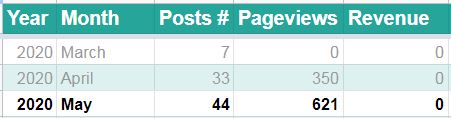
Nothing much to say here. It’s a baby in the cradle, not even taking its first steps. Still deep in the sandbox.
Expenses and Investment in May
Unlike with revenue, I can only provide estimates here. It’s just too time-consuming to try and collect every little payment out there.
The exception is the cost of written content (how much we pay writers). I calculate the cost of content by taking the overall number of words that we published and multiplying that by 3 cents (which is how much we pay writers per word).
We produced less content this month. That’s not a good thing, but it is part of the natural fluctuation in the number of writers. It’s time for another recruitment round, which should happen sometime in June.
We also cut down on VA hours in May. All four VA’s stayed with us, but some worked for only 20 hours a week. Editor hours were also somewhat reduced (simply because we produced less content).
So here’s a breakdown of our expenses in May:
$100 – hosting expenses
$400 – Software (plugins, templates, task management, SEO tools, etc.)
$300 – Stock photos
$1,500 VA fees (four VA’s)
$500 Editor fees
$288 Ezoic premium fees
$4,767 writers
That comes to a total of $7,855 (compared to $9,294 in April).
There was some confusion in previous reports about this part, so I’m going to start separating ongoing expenses from content investment. This isn’t easy to do because I consider editor fees and at least most of the VA fees as a content investment. If we were to stop producing content tomorrow, we’d only have to keep paying for hosting and some plugins.
With that in mind, this seems like a sensible division to me –
Expenses – $1588
Content investment – $6267
I still think bundling the two together makes sense. Our business plan involves a regular investment in content every month, so you could say content is an expense. Or you could look at it separately. Either way – the numbers don’t change.
The fiscal bottom line
We had a total of $13,262 in revenue and $1,588 in expenses and content investment.
That means we made $11,674 profit in May.
We then invested $6,267 into the content.
That leaves us with $5,407 “in the bank” by the end of the month.
Hold on.
That’s no longer in the red!!
That’s an actual profit of $5,407!

Mind you, that’s quite a jump. From around -$721 last month to $5,407. An increase of over $6,000. We did not anticipate that, and I confess, there’s a part of me that is intimidated by the fast growth. Don’t get me wrong – I am THRILLED that it happened. I just worry about the long-term sustainability of this growth rate.
With that in mind, I decided to include one more section in this report, discussing projects that are going on. These projects contributed to the increase in revenue, so this report won’t be complete without them.
Strategy adjustments and new projects
There has been so much going on this month that I barely had time to add a couple of posts here in between reports. Now would be a good time to share some of these developments.
Adjusting our portfolio strategy
Up to this point, our portfolio strategy went like this:
- Add one content site to the mix every quarter, launching it with 100 posts.
- Let it brew for an additional half a year, to see how the niche feels.
- If it’s going well, keep pushing content and making it into a significant authority site.
- If it doesn’t – no harm done, we have a smallish site in the portfolio that will pay for itself within a couple of years.
Some of the sites have been growing so nicely that I decided to focus on them for the time being. With that in mind, we won’t be launching a new site in Q2 or Q3. Instead, we’re focusing on growing existing sites and improving monetization. We already a couple of small sites that show good potential, so that’s enough “backburner” activity. We’ll see how they do later in the year and consider launching new sites based on that.
Here’s a breakdown of our current projects across the sites. I won’t go into too much detail at this point – some of these will probably become posts in their own right down the road.
Improving traffic for published content
We have over 2800 posts in our network of blogs. That’s quite a good chunk of content, some of it is even well-aged. Some posts do very well, bringing in thousands of pageviews each month. Most average somewhere between 100 and 1,000 pageviews. There are quite a few posts that don’t do well at all, bringing in less than 100 pageviews each.
It’s time to try and generate more traffic from these posts.
1. A big Pinterest Push
I was fortunate enough to get an early peek at Jon Dykstra’s new Pinterest course. I was hooked right away.
It’s not that I ignored Pinterest up until now, mind. Each post that we publish has a great pin image at the top, and we also pin actively for some of the sites. We use Tailwind to schedule pins and post to Tailwind tribes too. Still, I’ve felt for a while now that our Pinterest strategy has become stagnant. We’ve been doing the same old thing for two years now – too long in internet time.
Jon’s course came at a great time and offered a very attractive approach: treating Pinterest as a search engine, rather than a social media network. Me? I love doing SEO. I hate doing social media. The new system that Jon perfected fits my mindset very well.
As with SEO, this is a long-term approach, although I could see the needle moving within a week or so. I have a feeling that results may vary by niche, but all the same, I love the prospects of working on a traffic source that’s separate from Google. Diversifying is important.
Jon’s course is now available to all, so you can check it out right here.
2. Content Improvement
Talking to other web publishers (mostly over the Fat Stacks forum, available to people who buy the Fat Stacks courses), I became convinced to try and improve these numbers. I’m experimenting at this point, improving content for some older content, testing to see what works best for me in each niche. I hope to have some interesting data to share later this year.
Improving monetization
One of the most successful web publishers I’ve ever known (he doesn’t have a blog, so shall remain anonymous) used to say that he would never leave money on the table.
Up until now, I’ve been doing just that. I knew I was leaving some money on the table and I was ok with that. Picking up that money requires some amount of time/energy/attention. Unless there’s a significant amount of traffic involved, it may not be worth my time to deal with that.
With that in mind, so far, I’ve mainly focused on growing our traffic. I did monetize sites but without optimizing monetization. I kept telling myself that I need to reach half a million pageviews, and only then will there be enough money left on the table for me to worry about it.
Well, that point has finally come.
Here’s what I did – and am still doing – to optimize revenue.
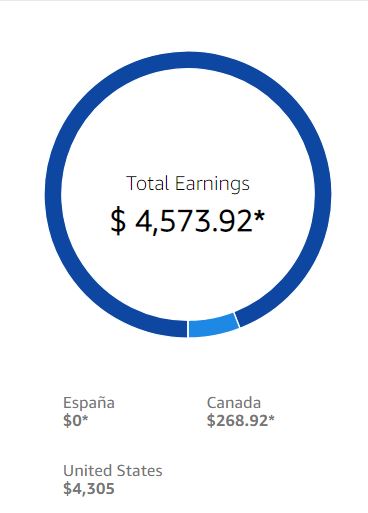 1. Amazon OneLink
Amazon.com offers you an option to sign up for other Amazon affiliate programs around the world and then merge everything so that anyone clicking on your affiliate link gets directed to their local Amazon program (with you still getting the commission).
I should have done that a while ago. It was easier than I had anticipated, and it brings in an additional 6%. In the last 30 days, that amounted to $268. In a year, that could be $3216. Not bad for the 15 minutes it took me to sign up.
2. CRO a/b testing
Our conversion rates with Amazon are fairly good. Usually above 10%. Still, you never know. Maybe a different call to action can increase conversions? Or perhaps we should use a button instead of a text link?
Now that we have a decent amount of traffic, we decided to run some a/b testing to improve conversions. This is known as CRO – Conversion Rate Optimization. I bought a monthly subscription to Nelio a/b testing, and we’re running some tests. So far, no dramatic news to share, but we’ll know more when we wrap up the experiments.
3. Testing new ad options
Apparently, Mediavine offers additional monetization options. If you opt-in, they can run two additional networks via theirs:
- Gumgum – offers in-image ads.
- Zergnet – offers Taboola-like additional searches at the bottom of pages.
Nothing very dramatic here. Together, they currently bring in an additional $5 a day. That’s $150 a month. Not a lot, but still, a few coins that were rolling on the proverbial table have now been picked up.
4. Monetizing video ads
I blogged about this option extensively here.
5. Testing push notifications
Push notifications can help you increase traffic, but some companies also offer a monetization plan where they use some notifications for ads and share the revenue with you. I’m currently testing that option on some of the sites.
6. Optimizing display ad – at the network level
I’m about to move some sites between networks to see if they can deliver better RPM’s.
7. Optimizing affiliate offers
In my experience, Amazon has the best conversion rates, hands down. I’ve been trying other affiliate networks and products, and they pale in comparison. However, I have a couple of ideas on how to further optimize the products mentioned in posts. It’s going to take a while to get to this specific project, but I wanted to mention it here as it’s another way to improve monetization.
In Summary
The month of May was great. Keeping up the growth trajectory is challenging, to say the least.
As web publishers, our business environment is very dynamic. This year, it’s more volatile than ever. I think that our basic model is solid and robust. Churning out enough good content should keep growing traffic and revenue, even if we don’t do much more. However, it’s time to try and improve things, going beyond the daily grind. As you can see, there are quite a few avenues that we’re exploring to try and make sure we keep an effective growth curve.
Please leave me a comment and let me know what May was like for you! And stay safe, always!
Thanks for the great report, Anne – and congratulations on the results!
Great Report Anne, congratulation on your results this month.
Like the breakdown of your adjustment strategy.
Just one point if you have any single product that you sell a lot of it, you can try to go direct to manufacture where you can get 50% to %100 increase commission. you can add the link next to Amazon link also so the visitor has the choice. usually, they will hit both to see price and you can get both cookies.
Nice work, Anne.
Do you do any link building at all? Or do you just focus on content?
Thanks, Luke.
No proactive link building. I think incoming links are important but rely on them occurring naturally over time. Posts that target long-tail queries well reach top positions without any incoming links. Then people link to those, pushing domain authority for the entire site over time.
Nice. It’s interesting that you are seeing very good results just purely focusing on content. Looking forward to the next update 🙂
Absolutely awesome! Thrilled for you and your success!
Thanks, Morten!
Dynamite update, congrats on a great month. So nice to see the “profit” after expenses.
Thanks for the detailed post on monetising videos earlier in the month too. In such as busy month! I think I should grab Jon’s Pinterest course.
Pretty excited to see how making the most of the ones that are surging goes. Cheers for the detailed monthly updates!
Thanks, Kit! I’m glad the video post was helpful. I think you’ll like Jon’s course too.
Amazing Anne! Well done, you made a whooping profit before you even broke even! Like you said though, 2020 is not your typical year! Anythin can happen! I will be very interested in your strategy of tackling optimizing affiliate offers and hope you can dedicate a post to that. Some very helpful insights in increasing/optimizing revenue added at the end! Congrats again!
Thanks, Cristina!
Congrats on hitting profitability! Awesome growth.
One thing I missed is the Google algo update in May, did you see a spike/dip in traffic on the 4th or 5th of May? Have you done any analysis here?
Hi Hugo,
There wasn’t any noticeable effect on any of my sites, so I never mentioned that.
Love seeing the increases! This is awesome great job! It is so nice when from one month to the next things just seem to “explode”.
Hey Anne, How long Mediavine took to approve you?
I applied for mediavine 3 weeks ago (18 May); they haven’t replied yet.
Hi Amit,
In my current experience, Mediavine takes 4-6 weeks to get approved, and then another 1-2 weeks to deploy. You can try shooting them an email if you don’t hear from them in another week. Just to make sure your application didn’t fall between the cracks.
What are are the split in traffic sources for your garden site. Google, FB, Pinterest, etc.
Hi Madison,
It’s about the same as my other sites. 80% from Google, %10 direct and the rest is social, mostly Pinterest.