Some posts only go to subscribers via email. EXCLUSIVELY.
You can read more here or simply subscribe:
June 2020 Traffic & Revenue Report
June was good. Overall, traffic was growing for most sites and our total revenue grew by an additional 20%. Time to take a closer look at what happened last month.
June was good. Overall, traffic was growing for most sites and our total revenue grew by an additional 20%. Time to take a closer look at what happened last month.
If you’re already familiar with my business model, use the table of contents above to skip to the juicy parts or go straight for the bottom line.
Contents
What is this report all about?
Recap: I have a portfolio of content/niche sites. This blog – Yeys.com – is where I document my progress in detailed traffic and revenue reports. I started doing this in 2019. You can find the previous reports here.
Note: I have another large site that isn’t covered in these reports because it’s a community (forum) site. I try to keep Yeys.com dedicated to my content sites venture. Keep in mind that I am an experienced web publisher and have a constant stream of revenue, which allows me to invest in new websites. This kind of investment is not something I recommend doing if you have no reliable source of income.
My Web Publishing Strategy And Our Team
My strategy is simple –
- Find underserved queries on the Internet.
- Publish the best possible answer to the query.
- Monetize.
Multiply this by dozens of posts a month, across several niches, scaling up by outsourcing.
I currently employ four VA’s and one editor (not all of them full-time). In addition to that, I work with 15-20 freelancers that write a total of around 150 posts per month. (If you’re curious about how I manage to produce so many posts, you can read here about my workflow).
My husband also helps, especially with strategy and analysis (that’s on top of his day job). That’s why you’ll see me using “I” and “we” interchangeably.
Our Portfolio
Here’s what our collection of sites looks like at this point.
These sites cover large niches, so they have a lot of growth potential. Some are already fulfilling that potential, having 500+ posts, and growing. Others are still at the sandbox phase.
- Travel
- Automotive
- Home Improvement
- Gardening
- Finance
- Style and fashion
- Kitchen
Small niche sites
These were “carried over” from previous years before we devised the current strategy. These sites are small and will remain small simply because of the scope of the niche.
- Pet Accessories blog (a specific type of accessories)
- Pets blog (specific small pet)
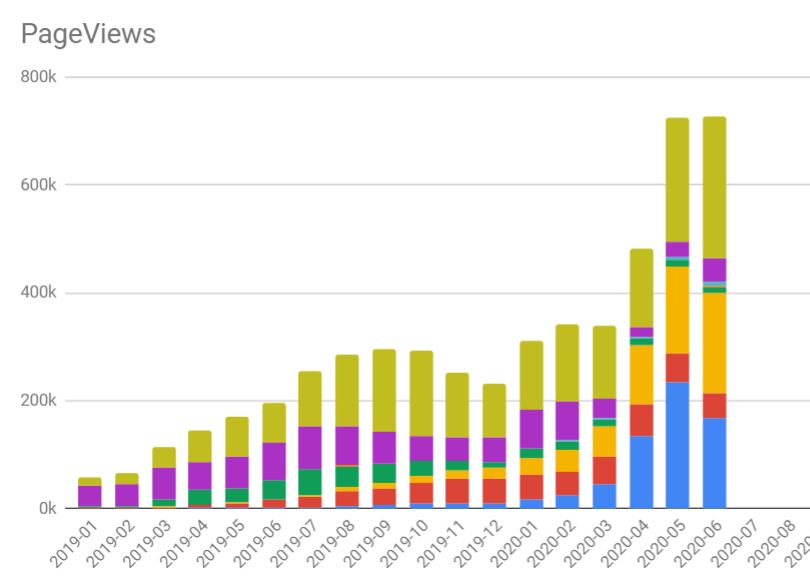
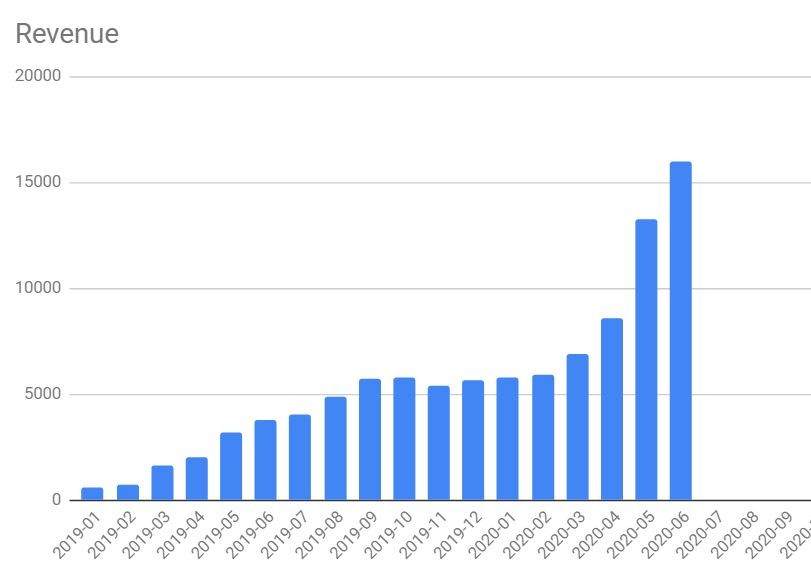
Traffic and Revenue for June 2020
Taking into account our entire portfolio, we had a total of 726,720 pageviews. Compared to 724,836 pageviews in May. That’s almost no growth – under 1%.
As for revenue, we made a total of $15,997 in revenue, compared to $13,262 in May. That’s an increase of about 20%! Pretty sweet, considering the overall traffic trend.
So, what happened here?
If you haven’t read my previous report, it’s easy to tell from the charts that May was a crazy month, both for traffic and revenue. In fact, I was worried this was some covid-related anomaly that will balance itself out in June with a decrease in traffic and revenue.
Fortunately, that wasn’t the case.
Why didn’t traffic increase? Well, it actually did. As you’ll see soon in the blog-by-blog breakdown, most sites kept growing in traffic. However, the gardening site went down in traffic. This was so significant, that it offsets the rest of the traffic growth. Looking at Google Trends, this seems like the normal seasonal pattern for the niche.
Let’s take a look at the numbers for June per blog.
The Travel Blog
Site history: This site was established in June 2016. I try to keep a personal tone in this blog, so while outsourcing the bulk of the writing, I’m the one writing the outlines, intros, and summaries for most of the posts.
Monetization: About 75% of revenue comes from display ads, managed via Ezoic. The rest is a combination of Amazon and Booking.com affiliation fees.
The blog currently has a total of 248 posts.
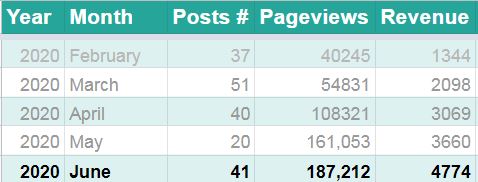
This site was making over $1500 in February. And then COVID happened and the travel industry took a severe blow. International travel pretty much came to a screeching halt. Domestic travel also slowed down significantly, with various areas in the US going through various degrees of lockdowns.
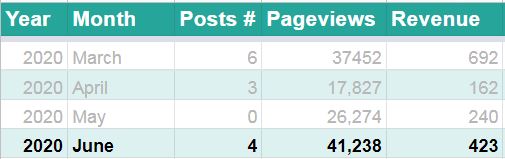
It looks like people are learning how to live with the pandemic, and travel traffic is on the rise again. In June, the site had 41,238 pageviews, compared to only 26,274 in May. Revenue increased accordingly from a measly $240 in May to a slightly-less-measly $423 in June.
It’s not close to its former glory though. This time of year, with this number of posts, I was expecting the site to go above 100,000 pageviews. Instead, we’re at just over 41,000. Still, it’s getting better and it’s nice to see some improvement in the niche.
The Automotive Blog
Site history: We started this blog in April 2018. The niche covers vehicles of various classes and types. The content is mostly informational with a few “best X of Y” product lists.
Monetization: The site used to make about 75% of its revenue from display ads via Monumetric and 25% from Amazon affiliate links. We switched over to Mediavine in the last week of June.
This blog currently has 727 posts, making it the largest in our portfolio in terms of content.
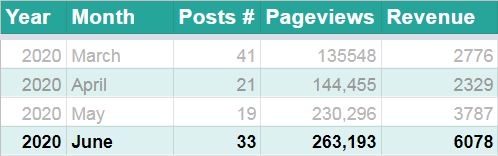
In May, traffic bounced back from the March corona slump and by June, we were seeing more traffic growth. We reached 263,193 pageviews, compared to 230,296 pageviews in April. That’s a decent increase of about 14%. Not as exciting as the 60% we had in June, but I actually prefer slow and steady over crazy fluctuations.
Talking about growing in leaps and bounds, the revenue totaled at $6,078 – compared to $3787 the previous month. This is mostly due to switching the site over from Monumetric to Mediavine, combined with what seems to be the usual higher RPM’s that the end of June typically brings. RPM’s typically grow at the end of each quarter, and it happened now as well. I can already see the expected decline on the first day of July.
The Home Improvement Blog
Site history: This site was launched in early 2019. The posts are a mix of informational and “how-to” posts, with inspirational picture posts and a few “X of Y” shopping guides.
Monetization: Used to be approximately 60% display ads (Ezoic) and 40% Amazon. We moved this site to Mediavine as well in the third week of June.
The blog currently has a total of 604 posts.
I was worried about traffic going down after that spike in May, but fortunately, it kept going up. Traffic went up by about 16%, from 161,052 pageviews in May to 187,212 in June. The revenue went up by about 30% from $3,660 to $4,774.
The higher increase in revenue is again, due to switching over to Mediavine, along with the higher end-of-June RPM.
The Gardening Site
Site history: This site was technically launched in September 2018 as a micro-niche site but was moved to a new domain in April 2019 when we decided to cast a wider net and turn it into an authority site. The content so far has been a mix of response posts, gardening guides, inspirational photo posts, and some “Best X for Y” product posts.
Monetization: During March and most of April, the site was monetized with nothing but Google Adsense and Amazon. In the middle of April, Mediavine finally accepted this website. We now monetize with both Mediavine and Amazon.
The blog currently has 479 posts.
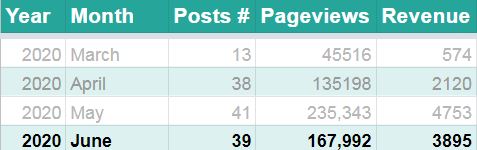
After a crazy couple of months in April and May, site traffic went down. From 235,343 pageviews in May to 167,992 in June. That’s a decrease of roughly 30%. Revenue followed suit with a total of $3895 down from $4,753 in May.
I was worried at first. This is the first year with this site out of the sandbox, so I wasn’t familiar with its seasonal patterns yet. I’m not into gardening and I sort of expected people to be out there working in their gardens all through the summer months. Then I checked Google Trends, and indeed, this seems to be the typical seasonal pattern in the niche.
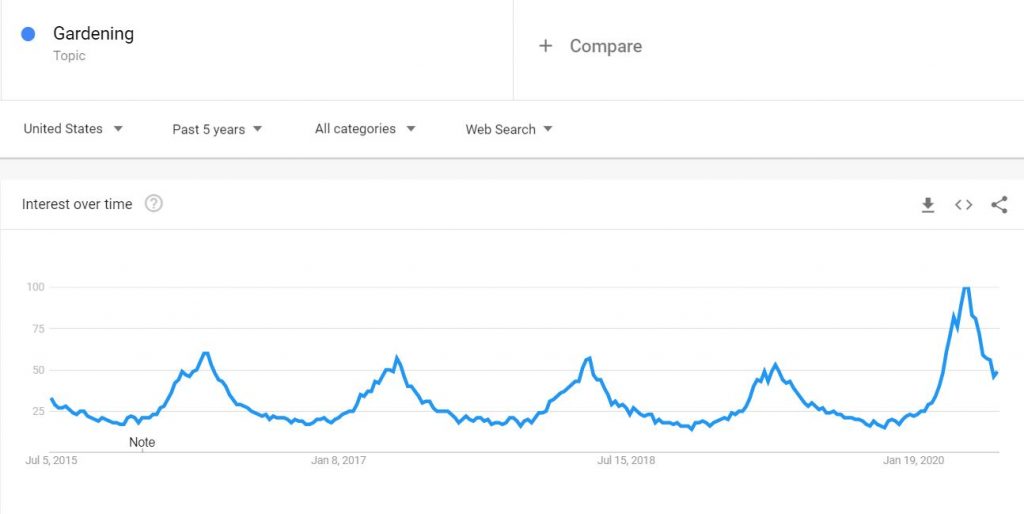
As you can see, the crazy high traffic was indeed covid-related in part, but it also synced with the typical seasonal pattern. Apparently, gardening traffic always peaks in May and then declines during June. In normal years, it kept declining, at a slower rate, all the way through to January-February of the following year. It’s still higher than average for June, so we’ll see what happens this year.
The Finance Blog
Site history: Launched in August 2019, this is an experiment in the YMYL field.
Monetization: None. The site is too small, and the traffic is too low. It does have some Amazon links in posts but not enough traffic for generating commissions.
The total number of posts remained 91.
This site is an experiment, and we won’t know how it goes until at least a year from now. One thing is clear: it’s still buried deep in the sandbox.
The Style and Fashion Blog
Site history: This site was launched in September 2019 (a few weeks after the finance site). The content is a mix of response posts, guides, and lists of inspirational images.
Monetization: No display ads. Amazon links on some pages.
The number of posts is 109.
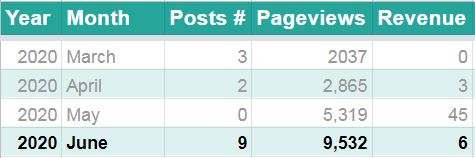
The site had 9,532 pageviews in June, compared to 5,319 in May. That’s a nice increase of about 80%. The site is now nine months old, so probably on its way out of the sandbox, though with most of its content younger than that, it’s probably just the beginning of that process. At least part of the growth can be attributed to Pinterest, where we applied Jon Dykstra’s Pinterest strategy with good results (I’ll post more on that later in the year).
The Pet Accessories Blog
Site history: This site was launched in March 2018. It includes high-quality guides relating to aspects of the topic (how to choose, how often to clean, etc.). We also have some “X for Y” lists.
Monetization: Display ads by Ezoic account for about half of the revenue, with Amazon bringing in the other half.
The site currently has 96 posts, but 18 of those are relatively new.
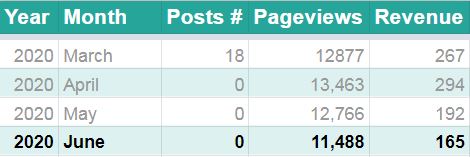
This particular site was doing very well over the summer, reaching over 40,000 pageviews a month and generating more than $2700 in revenue during August 2019. For some reason, it was hit during the October algorithm update and then again in November. Traffic has stabilized somewhat over the last three months, but the overall trend is downwards.
It just doesn’t seem to be able to recover in Google. The content push we had in March didn’t help much either. We may try a Pinterest push next, hoping to see some effect in Google too at some point. Still haven’t got around to that though – too much going on to deal with right now.
The small pets blog
Site history: This site was launched in October 2018, and we built it up to precisely 100 posts (with the last posts added in April 2019). As for the type of content, it’s mostly response posts, but there are some tip lists and “best X of Y” posts.
Monetization: The site is monetized with a combination of display ads via Mediavine and Amazon links. About 50% of the revenue comes from each of these channels.
The site has 100 posts.
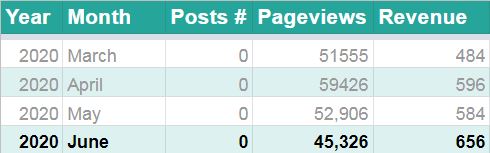
Traffic went down some more this month, from 52,906 to 45,326 pageviews. Revenue went up though, but not by much, from $584 to $656.
I’m not sure how concerned to be about the gradual drop in traffic. This website has been entirely passive for more than a year now. The last time we added content to the site was in April 2019. It’s good to see stability with a website at this stage. Another candidate for a possible Pinterest push to see if that helps.
The Kitchen Blog
Site history: This site was launched in March 2020. The plan is to build it up to precisely 100 posts. We’re going after long-tail response posts, with some tip lists and “best X of Y” posts mixed in.
Monetization: There are Amazon links in some posts but nothing else (it’s brand new).
The site currently has 111 posts.
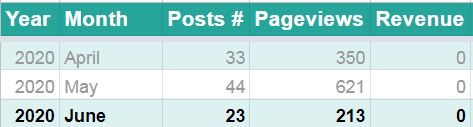
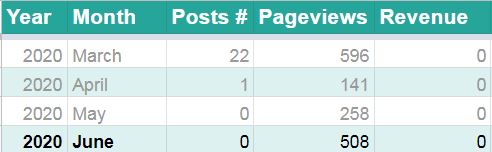
The site went down from 621 pageviews to 213 but that’s pretty meaningless at this point. I think it’s mostly due to the fact that fewer writers are messing around the site checking their own posts. We’re still deep in the sandbox.
Expenses in June
I used to bundle in expenses and investment in this section but that doesn’t really reflect the value produced by the sites. I mentioned as much last month, but this time around, I’m actually dividing these into two sections. Mind you, it’s not a clear and cut division – mostly an estimate.
So here’s a breakdown of our expenses in June. These are things that we would keep on paying even if we stopped producing or promoting content altogether.
- $100 – hosting expenses
- $400 – Software (plugins, templates, task management, SEO tools, etc.)
- $600 – VA cost for basic business management (I would keep this even if we stopped creating content).
That comes to a total of $1,100
Content Investment in June
The following is money that we decided to invest back into creating more content. If we stopped creating and promoting content altogether, this would be money in the bank.
We finally managed to produce 150 posts in June, after going down to 125 in May. A successful recruitment round during the second half of June helped with that. We also increased VA hours to 30 hours a week during June, and plan on going back to 40 hours a week for each of the four VA’s in July. In other words, content investment is on the increase.
- $300 – Stock photos
- $1,500 VA fees (VA hours that go directly into content production and promotion)
- $500 Editor fees
- $5,722 writers (overall number of words that we published multiplies by 3 cents).
Total of content investment: $8,022 (compared to $6267 in May)
The fiscal bottom line for June
We had a total of $15,997 in revenue and $1,100 in expenses.
That means we made $14,897 profit in June.
We then invested $8,022 into the content.
That leaves us with $6,875 “in the bank” by the end of the month.
We went up from $11,674 to $14,897 in profit. That’s an increase of 27%!
Even after investing more in content, we still increased our income from $5,407 to $6,875. An increase of over $1,000.
Some of that is thanks to switching over from Ezoic to Mediavine. This was long overdue. I applied more than two months ago, but Mediavine has quite a backlog of requests, so it was taking quite a long while. All done now, with two of our larger sites monetized via Mediavine, including video ads, it’s made a huge difference in revenue.
Other than that, the sites just keep chugging along. That is to say – we keep on chugging along with constant content production. Publishing a lot of quality content is the heart of this business model, and now we’re finally at the stage that it’s paying off.
If you’ve been following my reports for a while, you know that our bottom line was in the negative for many months. We invested around $150,000 into content over the past couple of years. While we’re finally making a decent profit each month, it’s going to take a while for the investment to be returned in whole – but I’m more confident now than ever that it’s going to happen.
As always, please leave me a comment and let me know what June was like for you! And stay safe, always!
Congratulations on another month of positive return.
you mention that you invest around $150k, how much of that you have get back over those months
cheers
You’ve certainly hit the point of it making a profit , giving you a positive return. Knocking it out of the park.. that is awesome.
Hi Anna,
What is the average length of your response post and how many such posts is your target at the beginning of any niche site you build?
Thanks.
Hi Nas,
It varies by topic, but anywhere between 1200 and 1800 words. I usually shoot for 100 posts, to begin with. Then I let the site “rest” for a few months, returning to it later to keep on pushing out content. I’m actually thinking of moving faster with the newer sites, without a wait period. Just constantly push out content. For each of the “potentially big” sites, I’m shooting for thousands of posts down the road.
Awesome breakdown, I really enjoy your format (and I’ve read a lot of case studies)! Being here for the first time, I was wondering: what is a response post?
Thank you, Hendrik!
A response post is basically a post that answers a specific question. For example, “do eggs have iron”. The idea is to provide a thorough answer, and also include additional information that can help the reader.
thanks anne, darlene and i just getting started. Appreciate seeing and getting a peak at how you and your hubby progressing.
We are just beginning, about 6 months in. about 208 articles now…just touching 2000 month pageviews.
thanks appreciate your updates
greg
Hi Anne,
What is your experience or opinion about rewriting contents that are approved by Copyscape.
Hi Oz,
We ask our writers to make sure their content is 100% original. That includes re-spinning articles from other websites, even when changing the exact wording. If we catch a writer doing that, we won’t work with them again. Moreover, we ask that they use several resources in their research and we provide an outline with additional questions, so it’s very unlikely that the final post resembles any other post on the web.